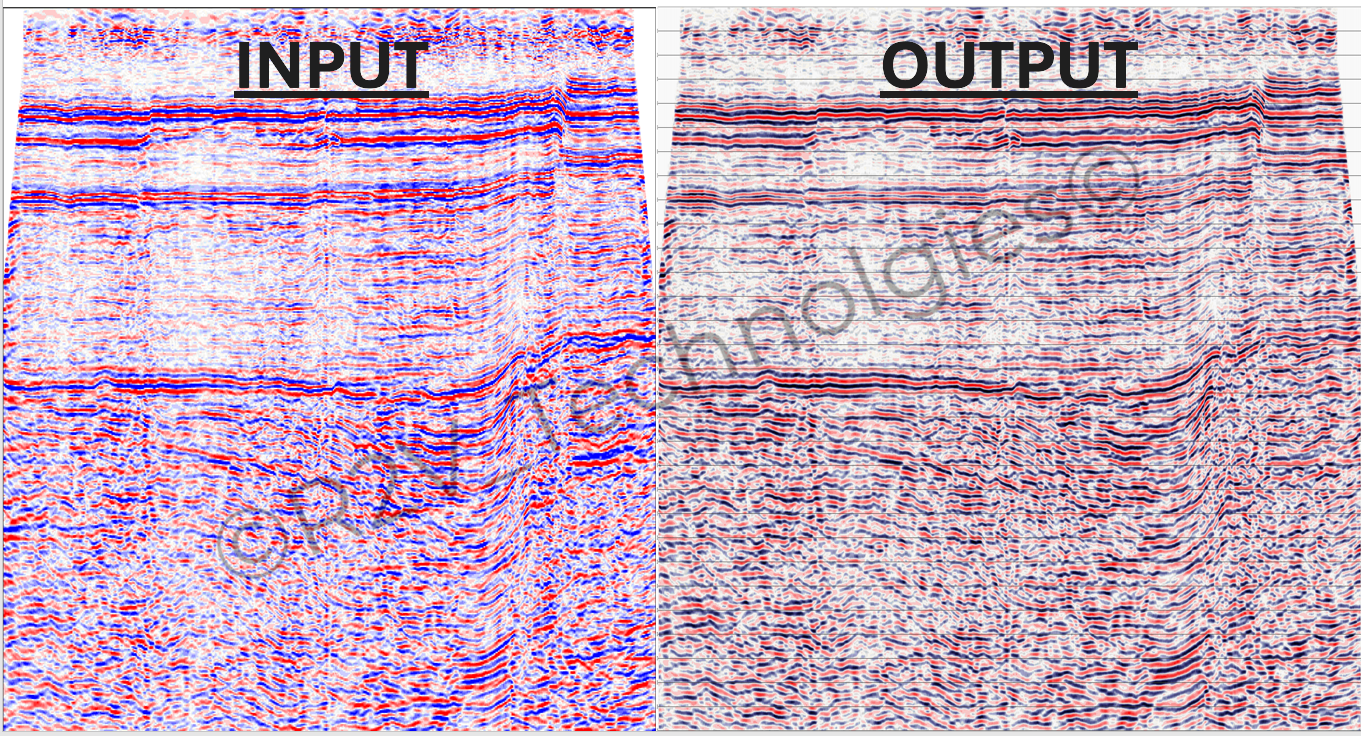
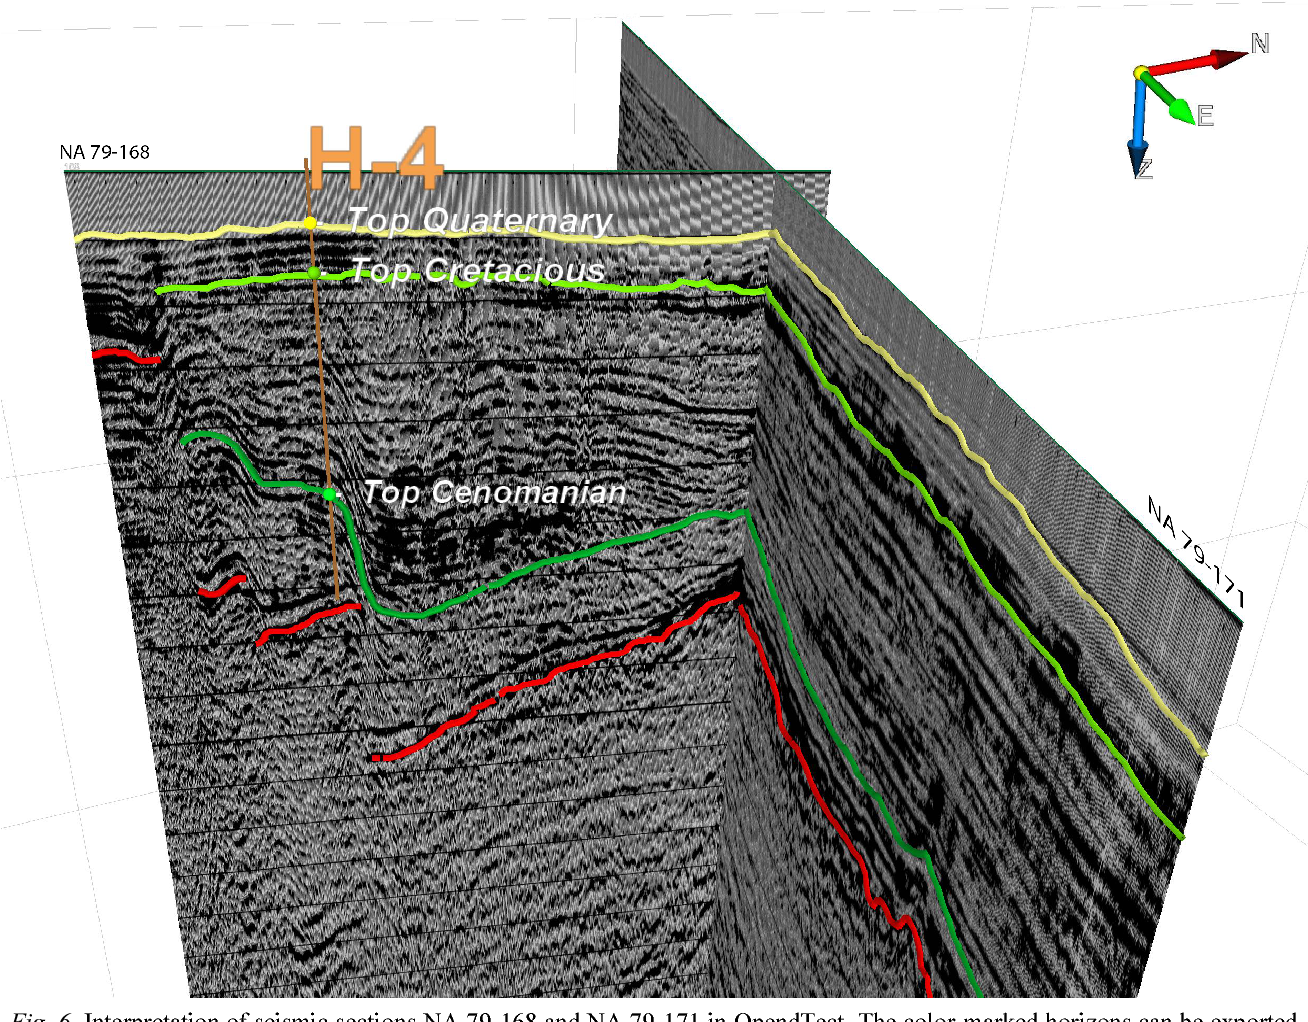
Seismic Vectorization
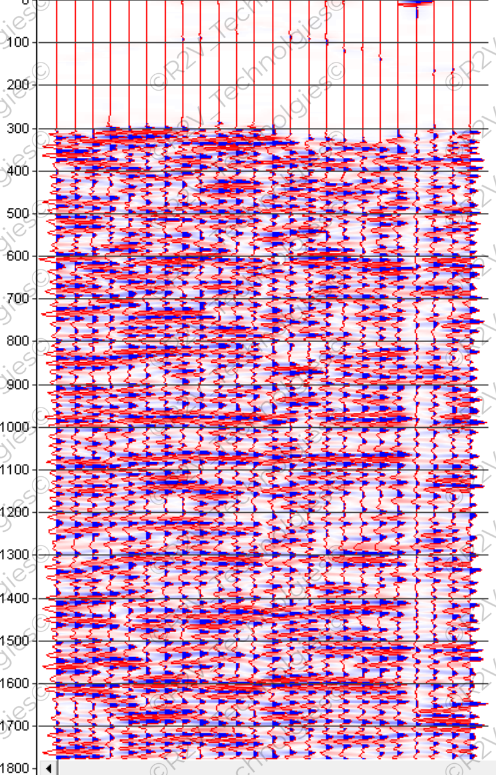
Seismic vectorization is the process of digitally converting analog or paper seismic data (like legacy wiggle-trace sections) into structured, computer-readable formats like SEG-Y. This unlocks historical geological data for modern 3D modeling, advanced processing, and geophysical reinterpretation.
The conversion process typically follows these core steps:
Scanning: High-resolution scanning of legacy paper or acetate seismic records.
Image Conditioning: Correcting for warping, rotating the image, and removing unwanted interpretation markings or timelines.
Data Extraction: Digitizing the seismic waveforms (peaks and troughs) to capture amplitude information.
Geometry Assignment: Mapping baseline positions, shot points, and coordinate (CMP) data to trace headers.
Standardization: Exporting the clean traces into industry-standard SEG-Y formats.
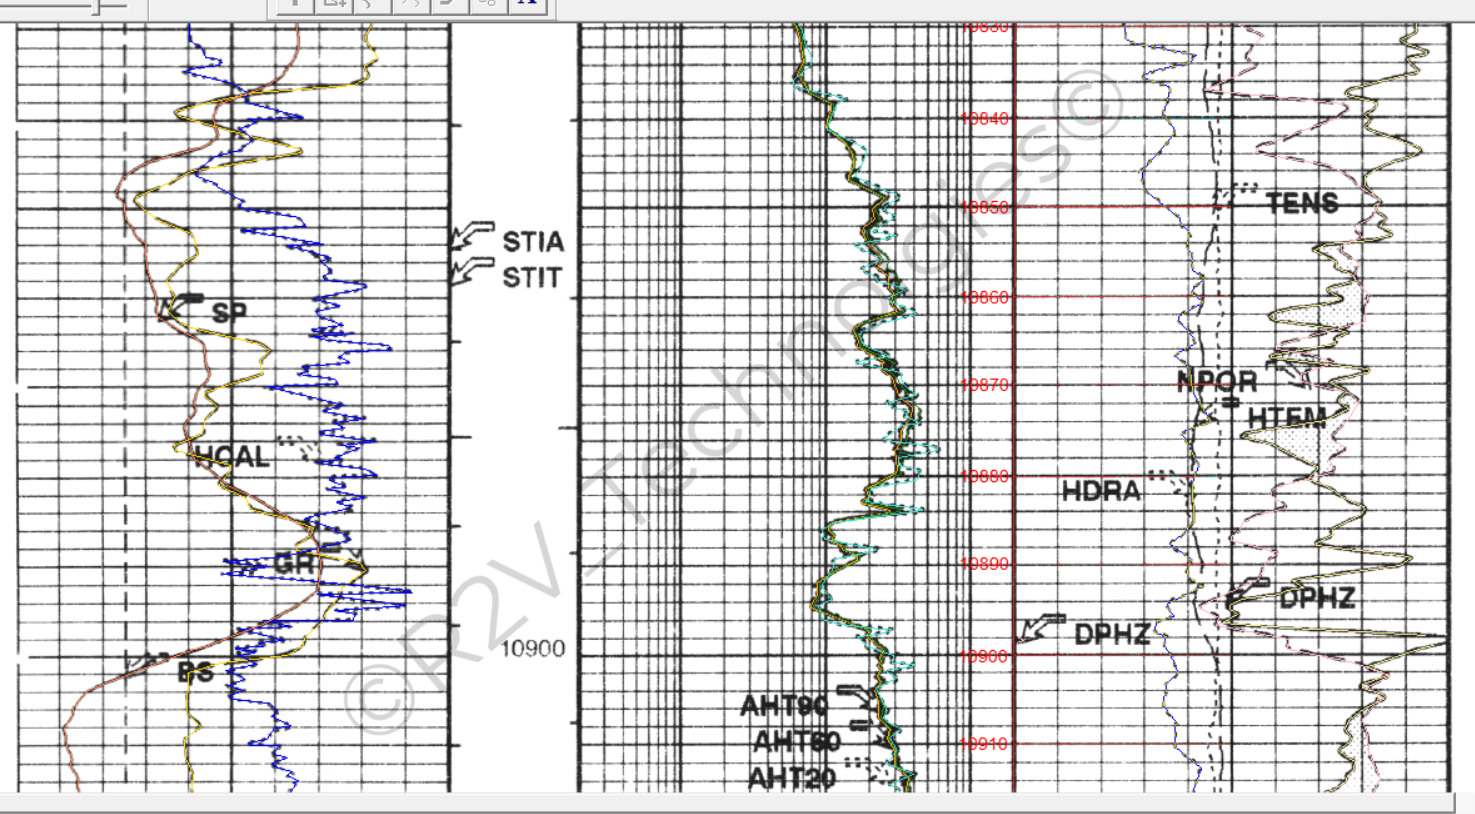
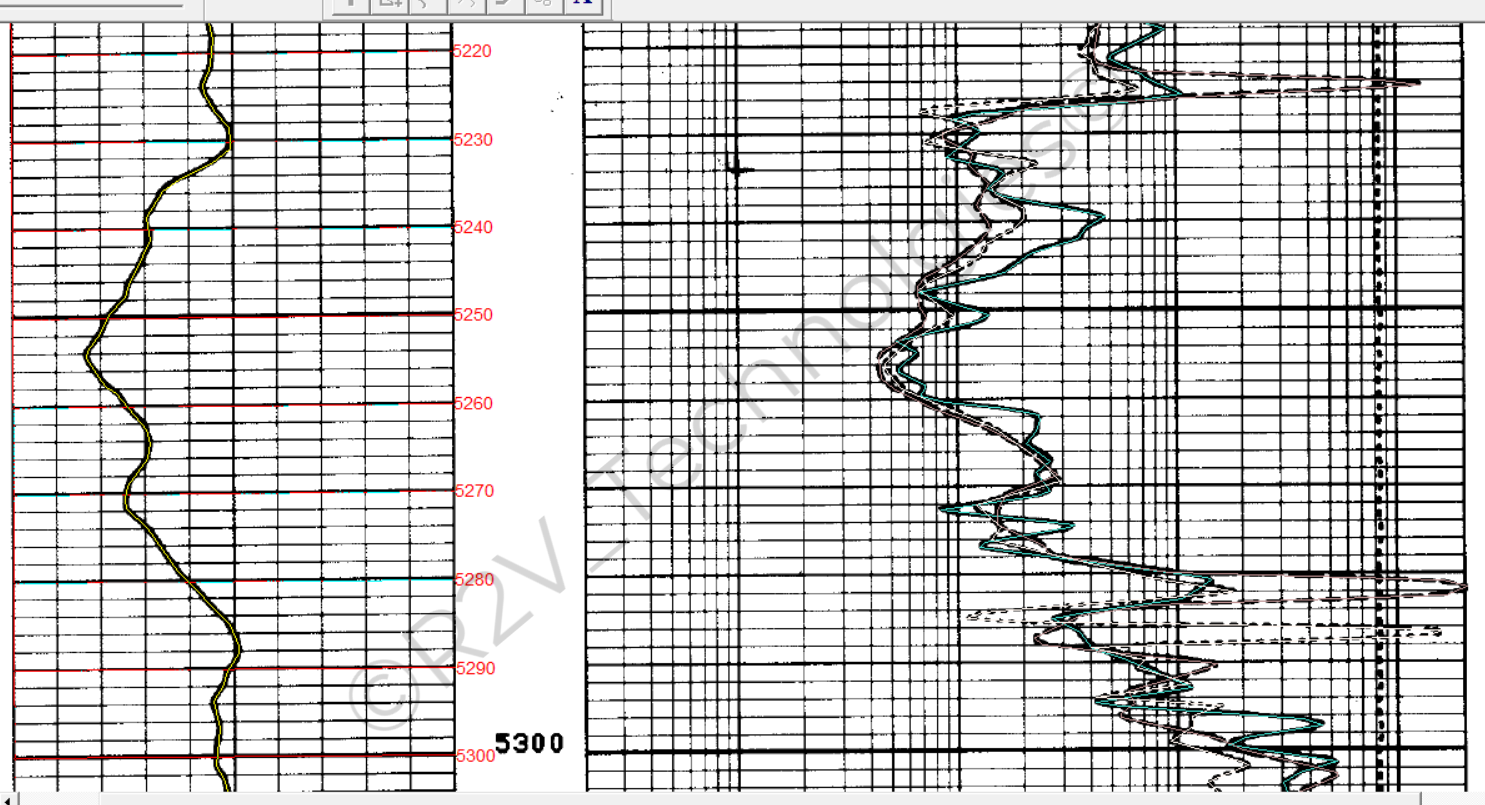
Well Log Data Digitization
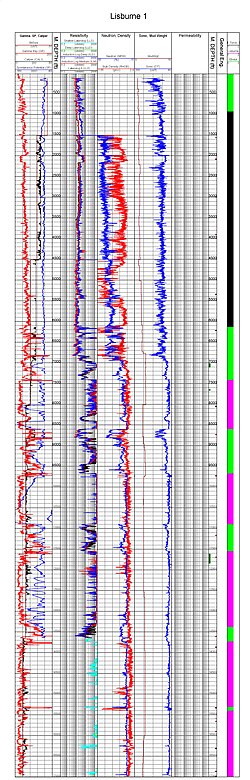
Well log digitization is the process of converting analog paper, film, or raster image (TIFF, PDF) well logs into digital formats, most commonly LAS (Log ASCII Standard). This enables petrophysical analysis and subsurface modeling. Automated, semi-automated, and manual methods are used to convert, edit, and validate log data to ensure high-quality digital input for geological interpretation .
At R2V Technologies we can convert all hardcopy well log data (paper, microfiche, films etc.), digital well log data (PDF, TIFF, JPEG, and BMP log images), and LIS, DLIS, LAS and ASCII files, processing them into industry standard interpretation ready electronic formats.
We have the geo-technical expertise to convert all hardcopy and analog images of well log to industry standard interpretation ready electronic vector format.
We accept any standard color, GRAYS-CALES , B&W , TIFF, JPEG, PDF, BMP for conversion, and even warped and stretched images are digitized.
Input-Output : All standard scales (imperial/metric) are accepted in input files-1”, 2”, 2.5”, 5”, 6”, meter. 10” scales is taken on customers demand. Images in different colors and extensions e.g. TIFF, B/W, JPEG, BMP, are accepted and Output is delivered in LAS (2.0, 1.2 versions-CWLS LOG ASCII STANDARD – VERSION 2.0) ASCII, PETRA ASCII, LBS etc. formats.
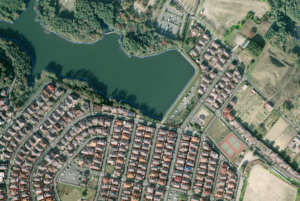
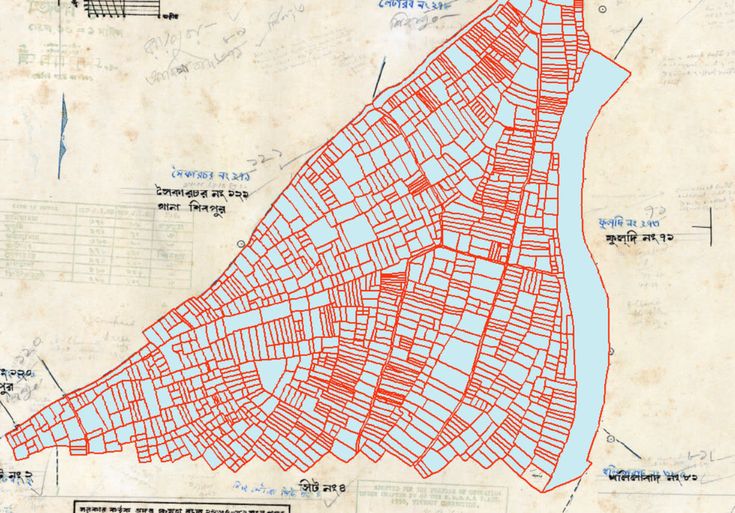
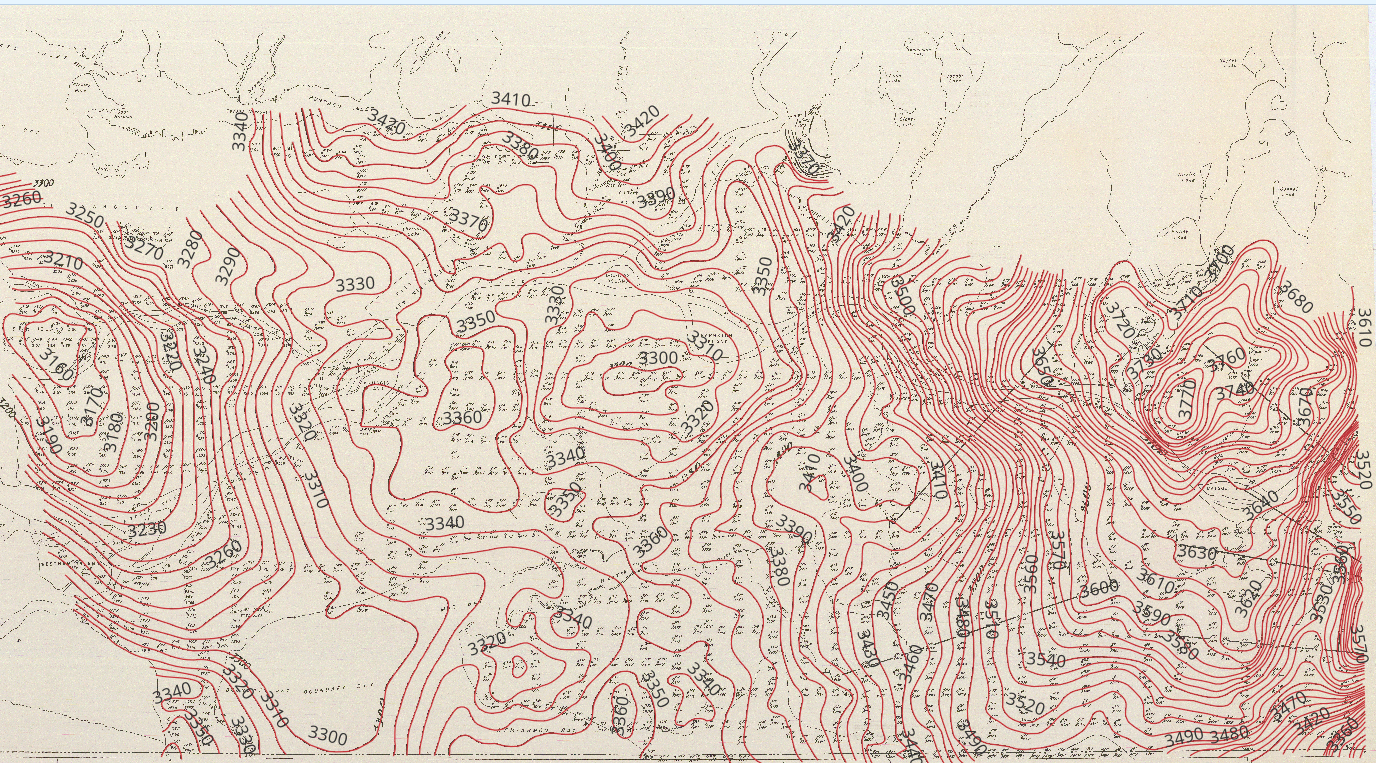
Map Digitization
Map digitization in GIS is the process of converting analog maps, scanned images, or aerial photos into digital, vector-based data (points, lines, and polygons) for analysis and editing.
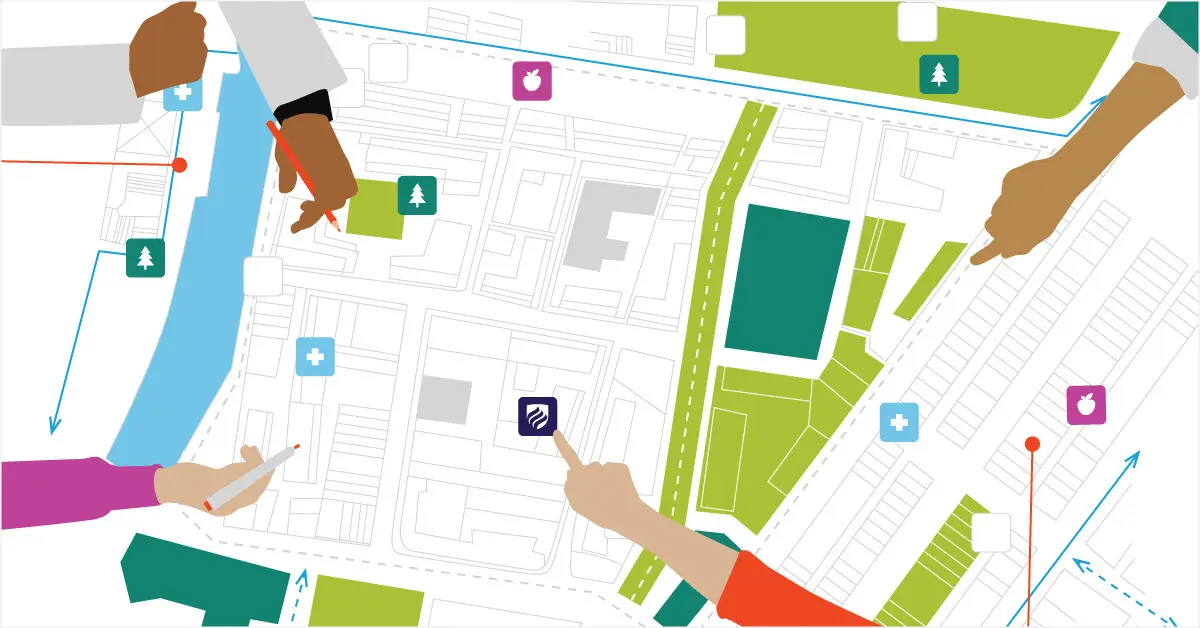
Vector Data Types:
Points: Used for specific locations like wells, buildings, or utility poles.
Lines (Polylines): Used for linear features like roads, rivers, or contour lines.
Polygons: Used for enclosed areas like lakes, land parcels, or boundary regions.
Our services include Land Cover Mapping, Utility Mapping, Tax Parcel Mapping, Thematic Mapping, Topographic Mapping, Contour Mapping, Cartographic Mapping, Road Network, Topo Sheets Analysis, Mapping for street navigation system, Ortho photographs rectification, Flood insurance rate mapping, Contour Digitization for Terrain Analysis, Soil and land use for agriculture, wetlands, airport, highway and Rail Mapping.
Our GIS Mapping services help in the areas of Forestry, Water management, Telecom, Power Distribution, Gas and Oil pipeline, Agriculture, Governmental schemes for developments for different Provinces and regions etc.
Inputs which are generally accepted are Geo TIFF, JPEG 2000, Mr SID, net CDR .
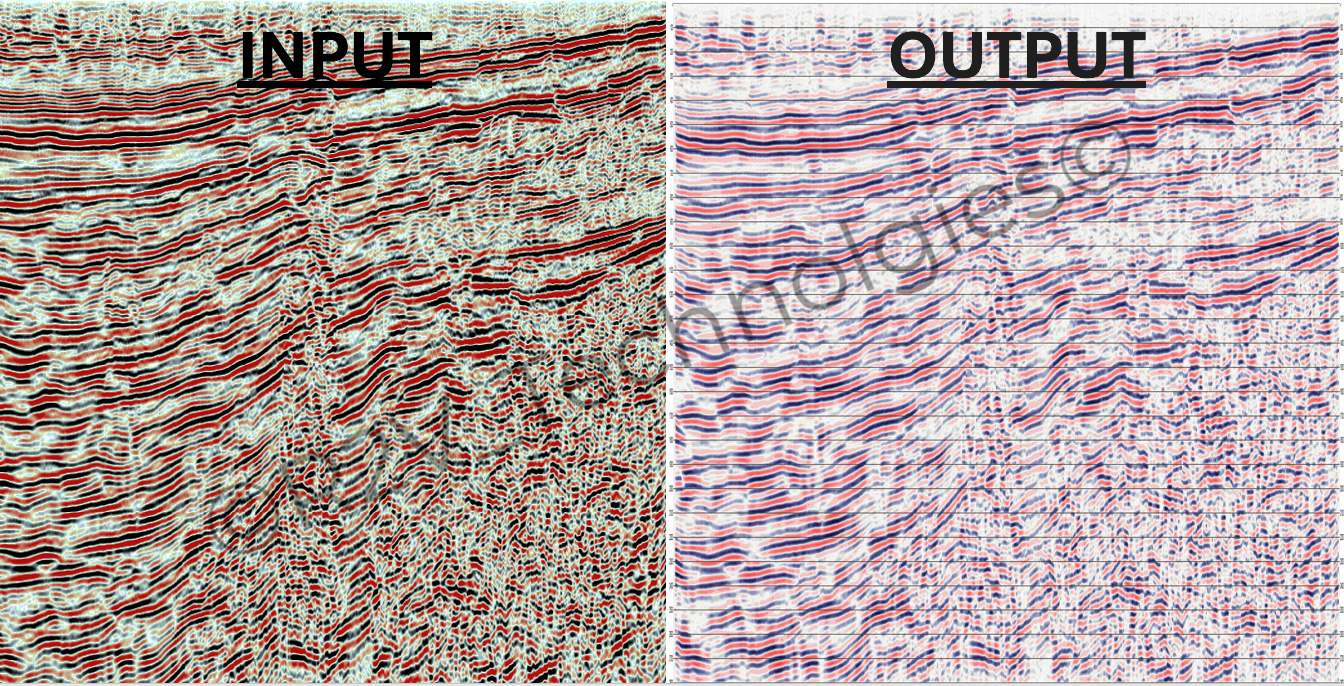
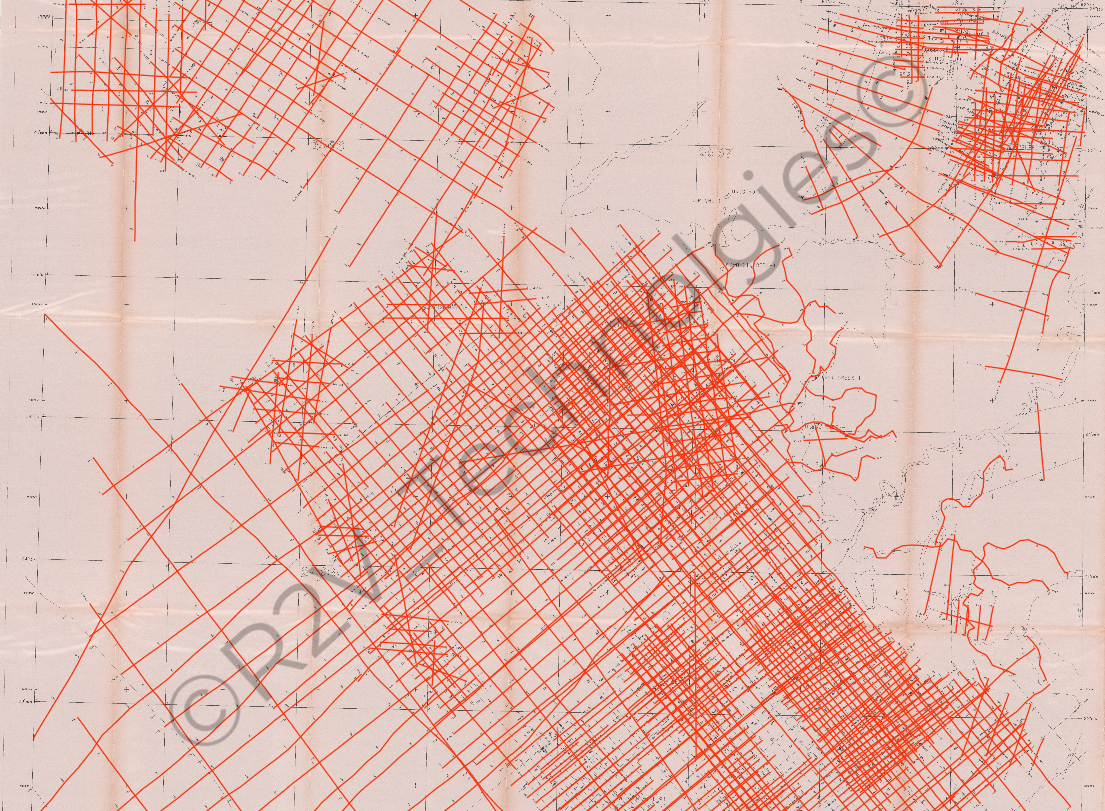
Shot Point Digitization
Shot point digitization refers to the process of converting physical seismic records—such as shot point maps, analog logs, or paper seismic lines—into digital formats for geological software .
It involves translating analog shot locations into usable (X) and (Y) coordinates .
It involves taking legacy 2D paper/raster seismic sections and converting them into digital SEG-Y formats. The coordinates of the shot points on the survey line must be extracted from physical base maps and merged with the trace data .
The Process includes :
Map Georeferencing: Shot point numbers and locations are digitized from scanned analog basemaps. Coordinates are calibrated using spatial referencing in a GIS environment.
Seismic Tracing: The raster seismic section is digitized. Specialized auto-trace and vectorization software reads the wiggly trace lines and negative phase signals from the image, preserving amplitude and frequency.
Navigation Merging: The extracted shot point locations (spatial coordinates and CMP data) are merged with the trace data headers to create a fully navigated SEG-Y file .
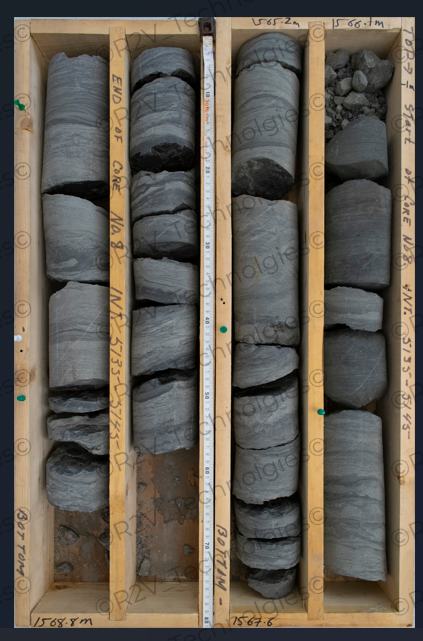
Core Photo Splicing
Core photo splicing refers to the manipulation of digital images by copying, pasting, or combining parts of two or more images into a single composite. This technique is used for creative photo editing, web design, or malicious forgery intended to deceive the viewer.
It is the process of cropping, aligning, and stitching raw core box photographs into a single, continuous, depth-calibrated visual log. During well log digitization, this spliced image provides a highly accurate, continuous geological baseline to calibrate wireline logs, identify lithologies, and calculate Rock Quality Designation (RQD).
Methodology :
Data selection – To start with , a small representative interval of the core photograph is taken and a classifier is trained to distinguish different lithology classes based on their textural and spectral characteristics . Data selected for initial classifier training should be representative of the entire well, and chosen carefully so that they contain all the potential classes that need to be identified .
Protocol development : can be defined as a set of rules and controlling parameters that are arranged in a sequential order and work together to automate core photograph classification. All parameters that best classify the core photograph, based on the experiments on the core photograph used in this study, are coded as a protocol.
Image segmentation : This is a process of partitioning an image into nonoverlapping regions. A multi-resolution segmentation algorithm is used for image segmentation, which is a region-merging technique that starts with single-pixel objects.
Knowledge-base design : It is used to define possible classes present in the core photograph. In this scheme, an expert trains a suitable classification algorithm by selecting representative objects for each class and defining features that could distinguish objects belonging to various classes.
Image classification : Classification is a process of assigning each segmented object to appropriate classes (lithology in this case) . The principle of image classification is that each object is assigned to a class based on its characteristic features, by comparing it to the predefined feature ranges in the feature space .
Seismic Record Field Digitization
Seismic record field digitization refers to the process of converting analog voltage signals from field geophones into discrete, time-tagged digital counts using an Analog-to-Digital Converter (ADC). This crucial step allows seismologists to apply modern digital signal processing, filter out noise, and store data in standard formats like SEG-Y.
The Digitization Process :
Analog to Digital: Continuous voltage outputs from field sensors (geophones) are sampled at specific intervals and converted into binary digital values.
Sampling Rate: Defines how many times per second the signal is recorded (e.g., 500 Hz or 1000 Hz). The sampling rate must perfectly respect the Nyquist theorem to prevent aliasing.
Resolution: Modern data acquisition systems utilize 24-bit ADCs, providing a high dynamic range to capture both minuscule micro-seisms and massive ground motions.
Tadpole Digitization
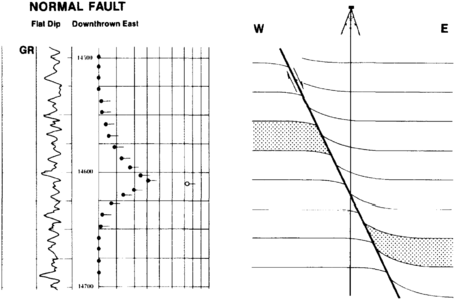
A Dipmeter is a specialized wireline well logging tool used to measure the angle (magnitude) and direction (azimuth) of subsurface rock layers. By identifying the dip of geological formations, it helps geologists map underground structures, trace sedimentary environments, and detect faults or folds.
The determination of dip angle and direction of a planar surface requires the elevation and geographical position of at least three points. Dipmeter tools achieve this result by measuring some sensitive formation parameter by means of three or more identical sensors mounted on caliper arms so as to scan in detail different sides of the borehole wall.
The most common presentation of dipmeter data is the arrow or tadpole plot, which is two-dimensional representation of a three-dimensional quantity .
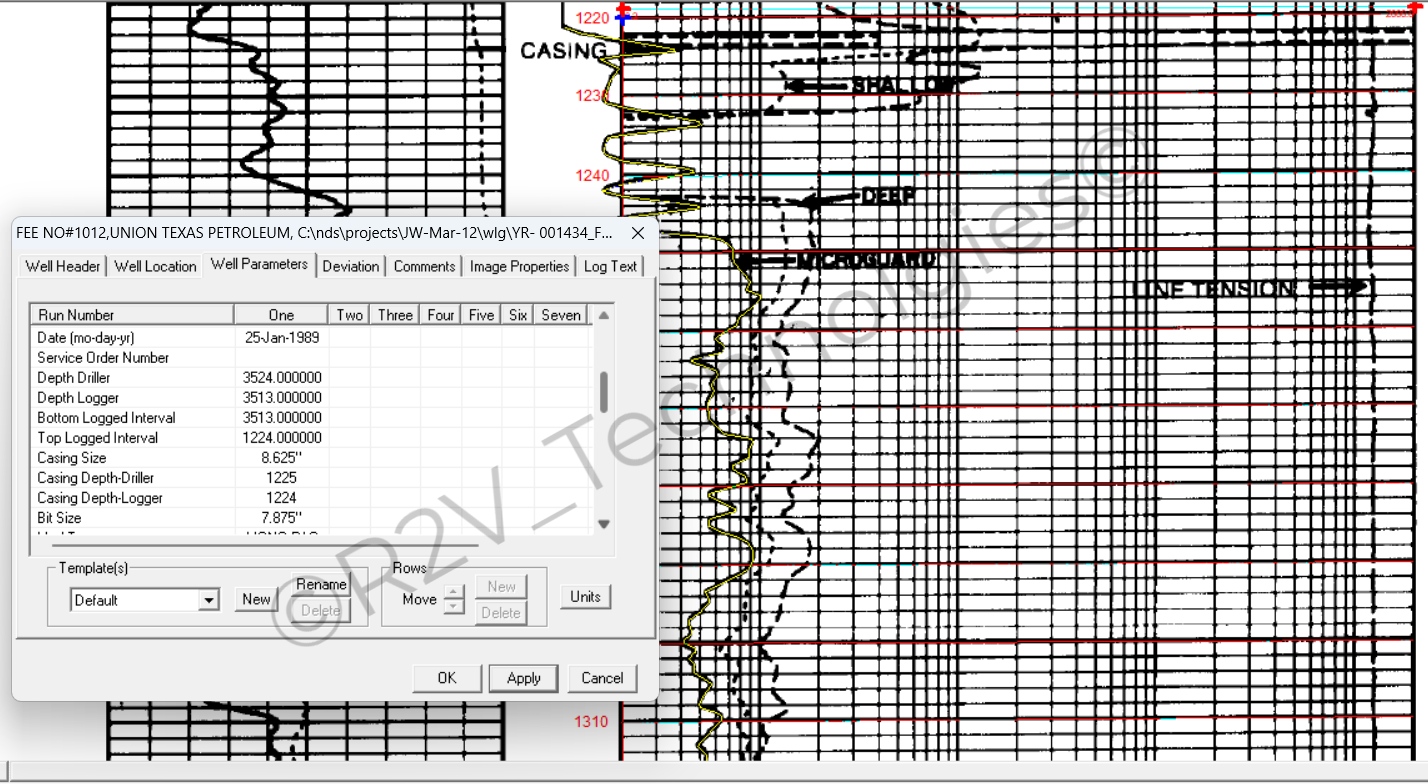
Header Capturing
Header capturing in well logging is the process of extracting critical metadata from the header section of a physical or scanned well log and converting it into a standardized digital format, such as an LAS, ASCII, or Excel file.
LAS Header includes :
Well name
API No.
Service company
Client
Country and State name
County
Field name
Location and other drilling information .