Seismic Data Vectorization

Accurate Seismic Data Vectorization for Modern Geophysical Interpretation

At R2V Technologies, we provide professional Seismic Data Vectorization services for oil & gas companies, geophysical consultants, and exploration organizations worldwide. Our expertise lies in converting legacy seismic sections, raster images, and analog geophysical records into accurate digital vector data suitable for modern interpretation and subsurface analysis.
Seismic data vectorization is the process of converting scanned seismic sections, paper seismic records, and raster images into digital vector formats that can be used for seismic interpretation, structural mapping, geological modeling, and exploration studies. This process helps preserve valuable historical geoscience data while making it compatible with modern geophysical software platforms. With decades of industry experience and a team of skilled geophysicists, R2V Technologies delivers high-quality seismic vectorization solutions with exceptional accuracy and data reliability.

Our Seismic Vectorization Expertise

We specialize in digitizing and vectorizing a wide range of seismic and geophysical data, including:

2D Seismic Sections
Raster Seismic Images
Paper Seismic Records
Geological Maps
Structural Contour Maps
Horizon & Fault Interpretations
Time & Depth Sections
Legacy Geophysical Data Archives

Our team carefully extracts seismic information from scanned images and converts it into interpretation-ready vector datasets for further geological and geophysical analysis.
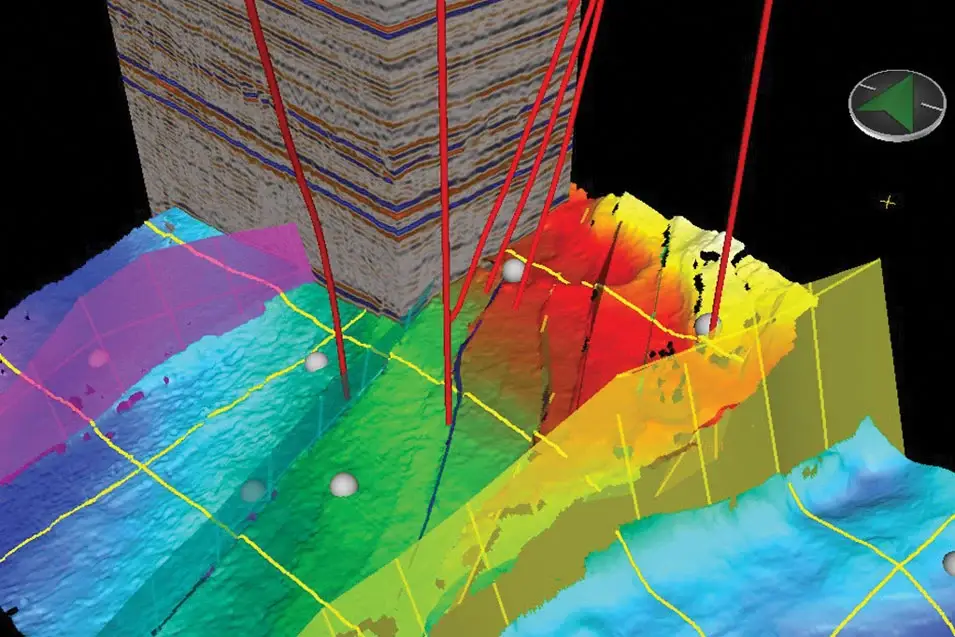
A 3D computer visualization of subsurface geological seismic data against a black background. The model features a vertical block of layered seismic cross-sections intersecting a brightly colored, undulating 3D horizon surface, where colors indicate depth variations from blue to red. Several solid red lines representing wellbore trajectories drill down into the formation. The visualization also includes translucent yellow and purple fault planes cutting through the surface, small white spherical markers, and a green directional compass graphic in the upper right corner

Supported Input Formats

R2V Technologies accepts various industry-standard input formats for seismic data conversion, including:

TIFF
PDF
JPEG
BMP Black & White Images
Grayscale Images
Color Seismic Sections
Scanned Paper Records
Film-Based Seismic Data.

We can also process distorted, faded, warped, and low-quality seismic images using advanced image enhancement and correction techniques.
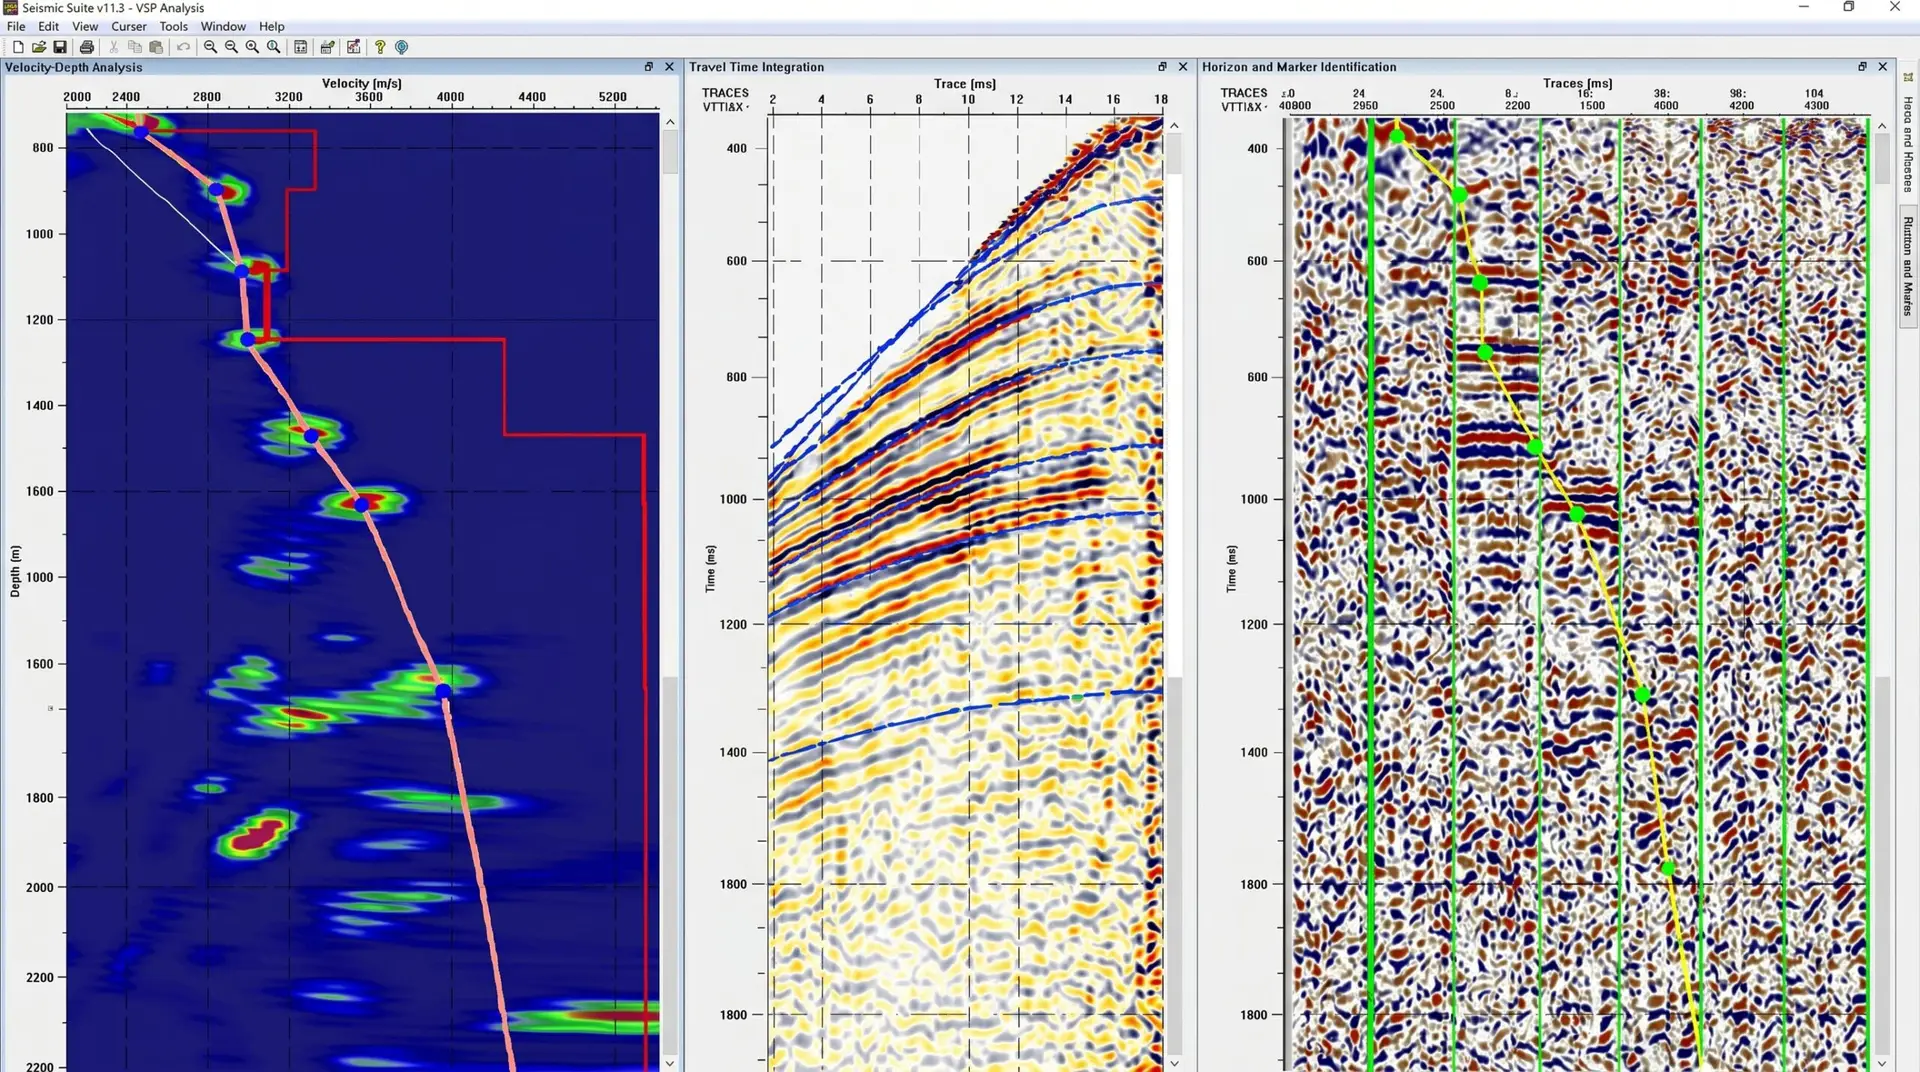
A three-panel software interface displaying seismic velocity analysis. The left panel shows a velocity semblance plot with a dark blue background and colorful heatmap peaks, overlaid with a connected line picking the velocity profile and a stepped red boundary line. The center panel displays a seismic gather showing hyperbolic reflection events, overlaid with blue curves indicating normal moveout (NMO). The right panel shows a different view of the seismic traces with vertical green guide lines and a yellow line marked by green nodes tracking a downward-sloping trend across the data

Output Formats Delivered

We provide seismic vectorization outputs in multiple industry-compatible digital formats based on client requirements.

Output deliverables include:

ASCII Formats
Vector Data Files
Interpretation-Ready Digital Files
GIS-Compatible Data
Customized Client-Specific Formats.

All output data undergoes strict quality control to ensure accurate tracing, depth consistency, and reliable interpretation results.
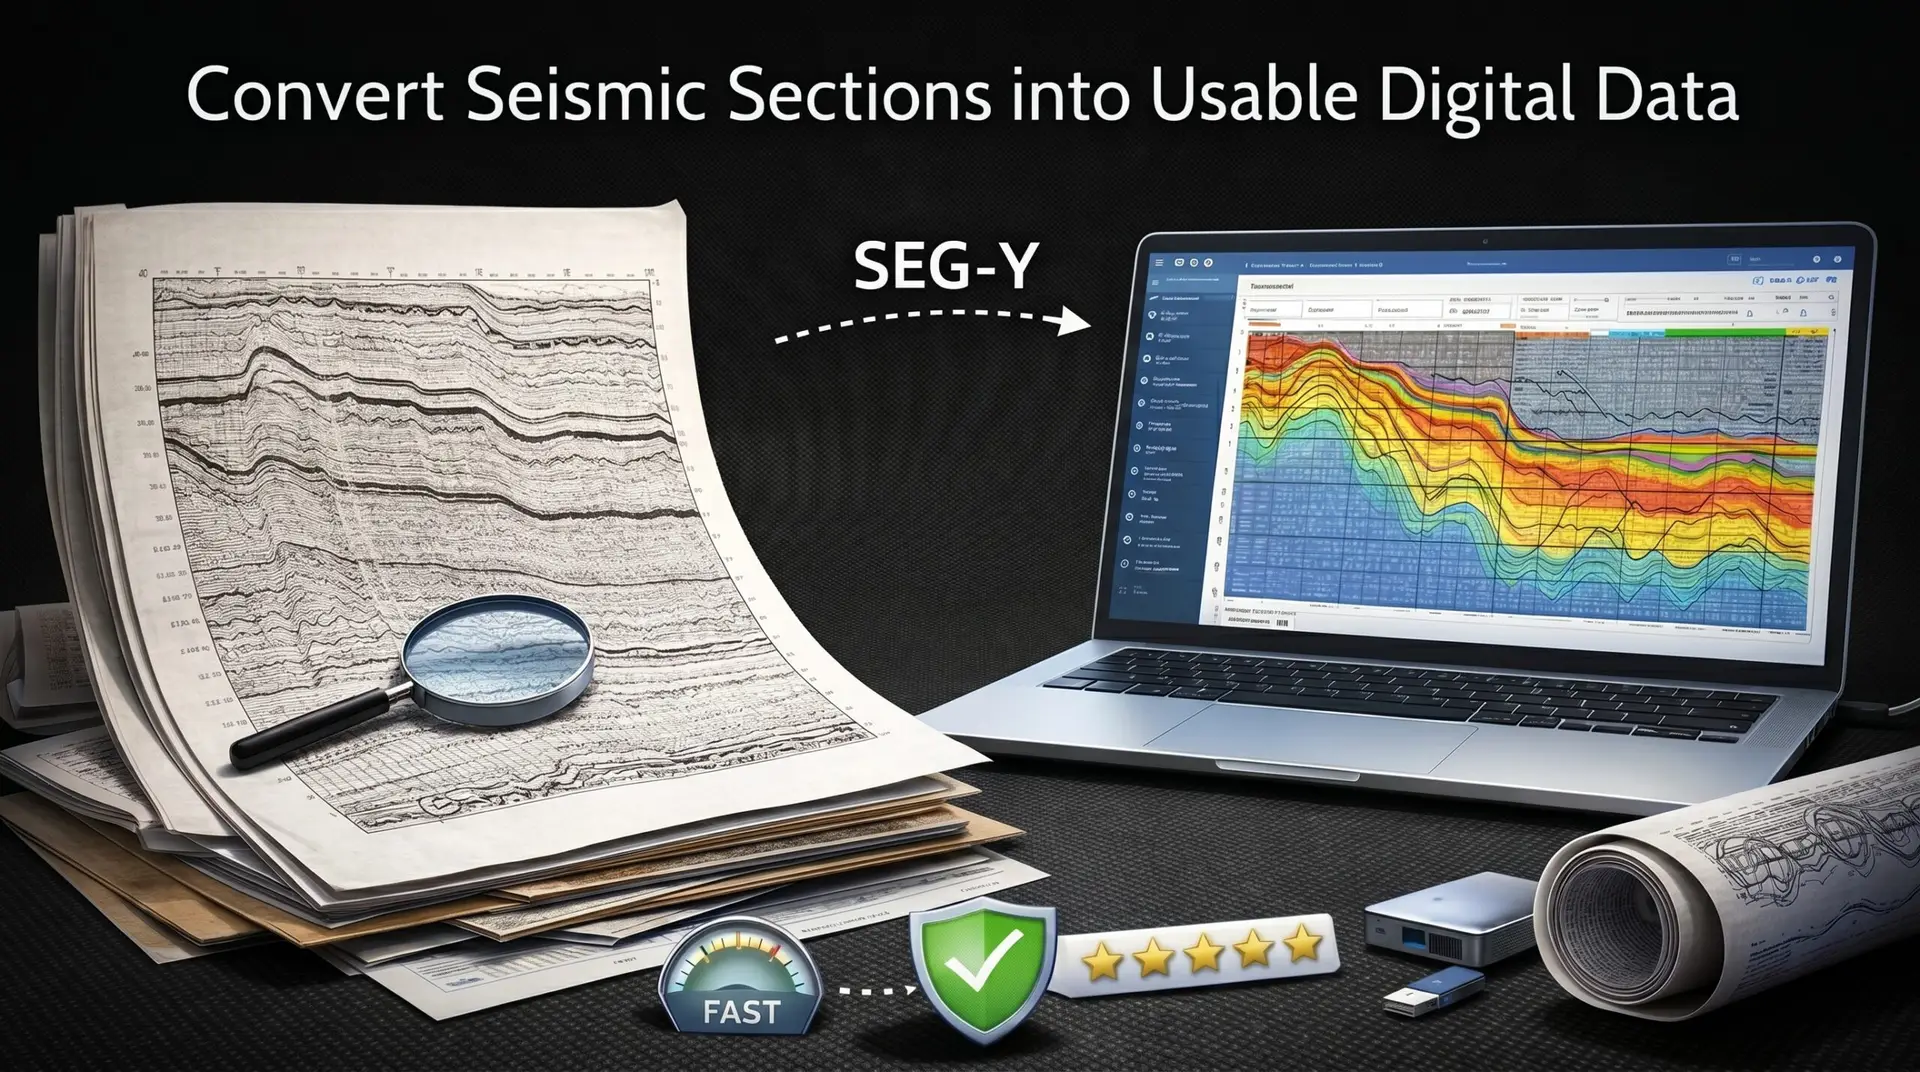
An illustrative graphic titled 'Convert Seismic Sections into Usable Digital Data' set against a dark background. On the left, a stack of physical paper seismic records rests beneath a magnifying glass. A dashed arrow labeled 'SEG-Y' points from the paper stack toward an open modern laptop on the right, which displays the converted, brightly colored digital seismic data on its screen. The bottom foreground features trust and performance icons, including a 'FAST' speedometer, a green security shield with a checkmark, and five gold stars, alongside a rolled-up blueprint and a portable storage drive

Advanced Seismic Digitization Workflow

Our seismic vectorization process combines advanced software tools with expert manual validation to achieve high levels of precision.

Our workflow includes:

High-resolution image processing
Raster-to-vector conversion
Horizon and fault picking
Coordinate calibration
Noise reduction and image enhancement
Manual quality checks
Final data validation and verification.

This ensures clean, structured, and highly accurate seismic datasets for exploration and reservoir studies.
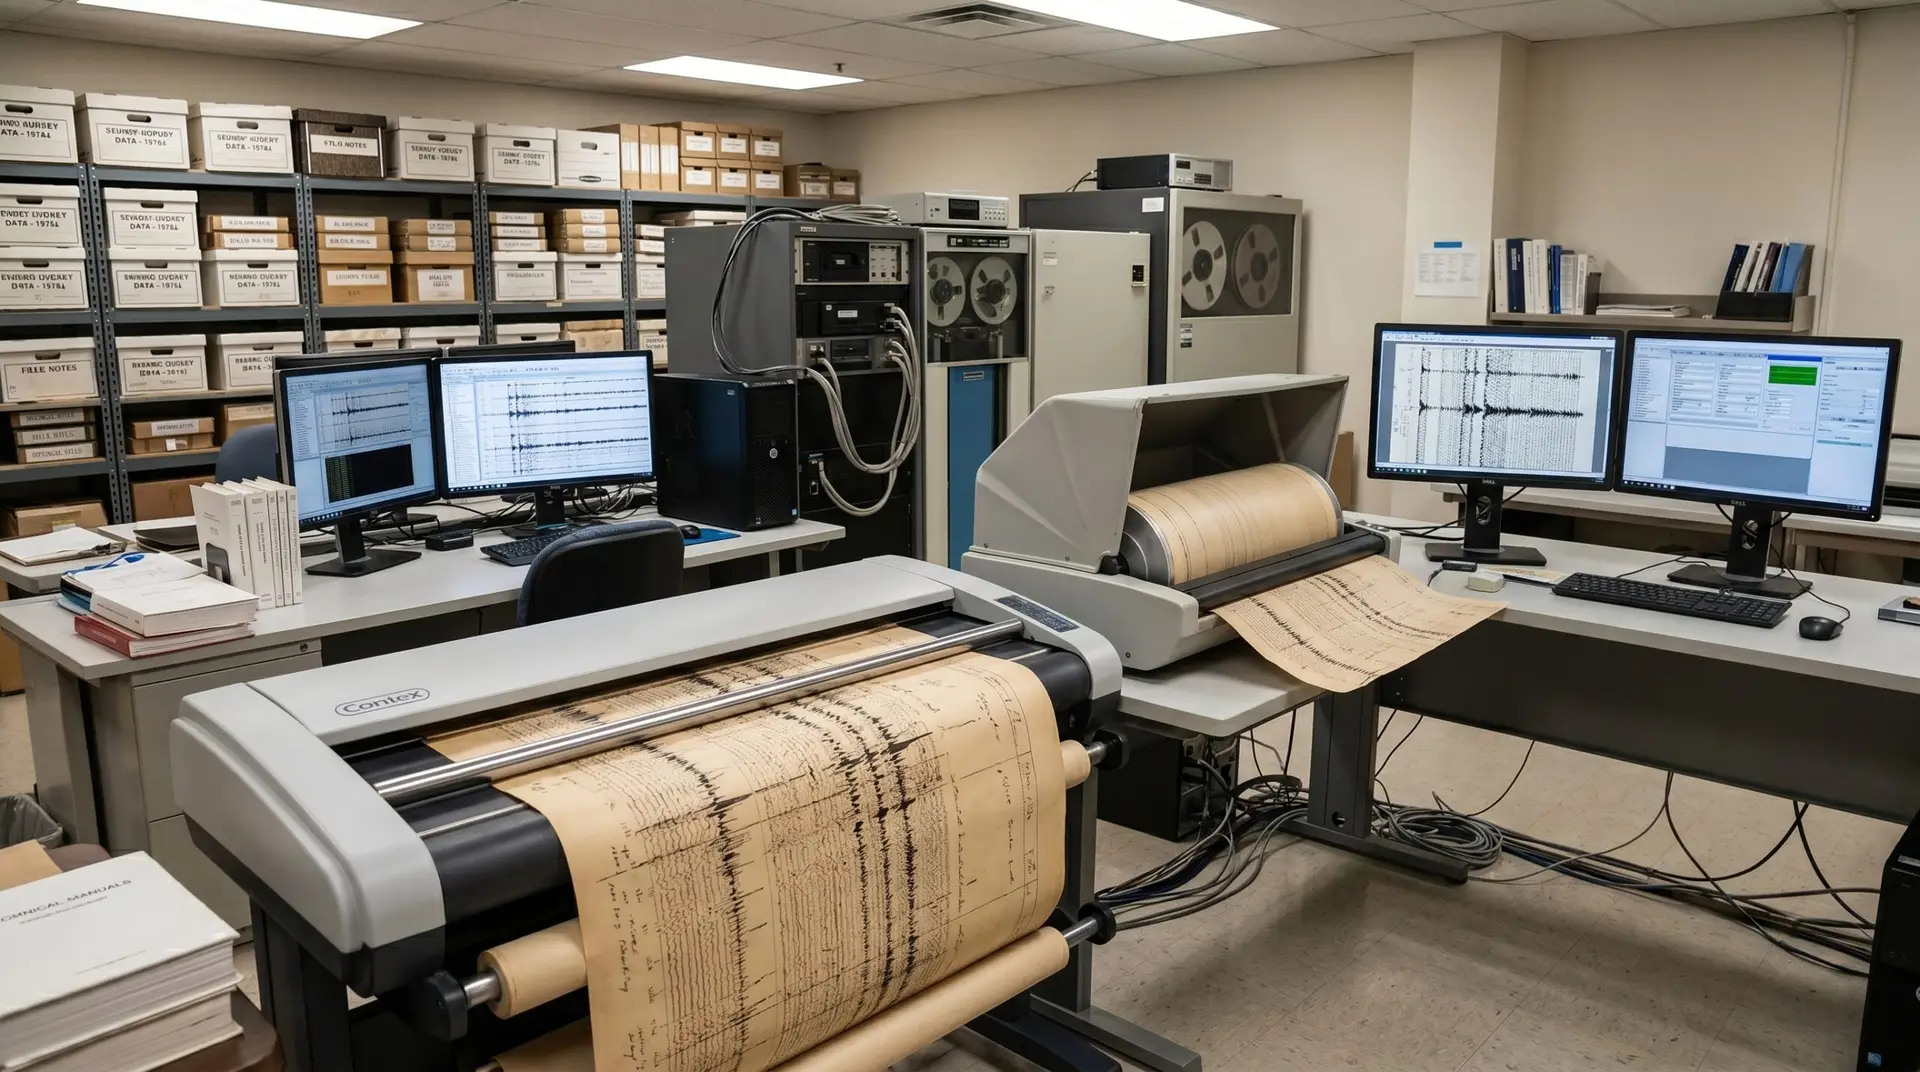
A specialized data digitization laboratory showcasing the conversion of legacy analog records. In the foreground, a large wide-format Contex scanner is processing a continuous roll of aged paper displaying physical seismic wiggle traces. To the right, another specialized scanner handles a similar paper record. Behind these are two dual-monitor computer workstations actively displaying the newly digitized seismic data on their screens. The background features tall metal shelving units tightly packed with labeled cardboard archive boxes on the left, and vintage open-reel magnetic tape drive cabinets on the right, illustrating the transition from physical and legacy media to modern digital formats

Applications of Seismic Data Vectorization

Digitized seismic data supports a wide range of upstream oil & gas and geoscience applications, including:

Seismic Interpretation
Geological Mapping
Basin Analysis
Structural Interpretation
Reservoir Characterization
Exploration & Production
Planning Subsurface
Modeling Historical
Data Recovery
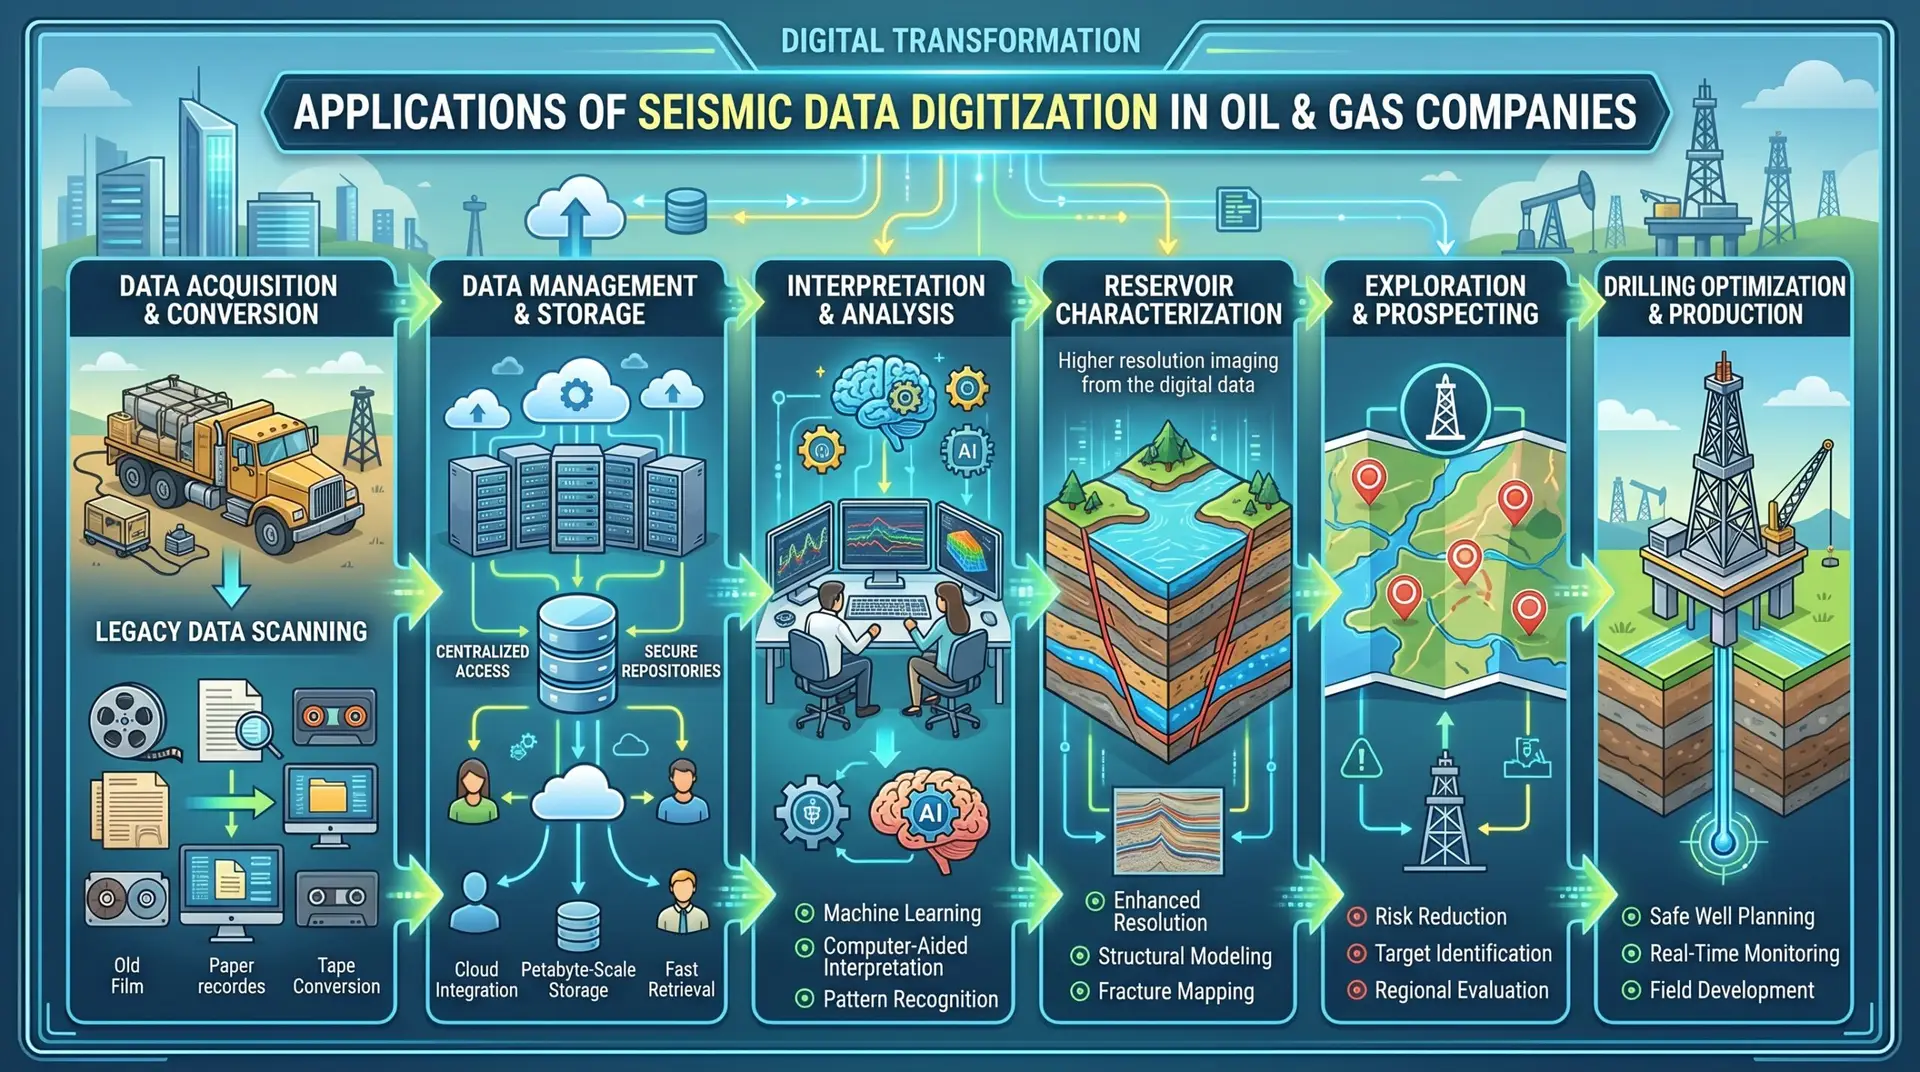
A comprehensive infographic titled 'APPLICATIONS OF SEISMIC DATA DIGITIZATION IN OIL & GAS COMPANIES' mapping a six-step digital transformation workflow. From left to right, the panels illustrate: 1) 'Data Acquisition & Conversion,' showing the scanning of legacy paper records, old films, and tapes; 2) 'Data Management & Storage,' depicting cloud integration and petabyte-scale server repositories; 3) 'Interpretation & Analysis,' featuring geoscientists at multi-monitor workstations utilizing AI and machine learning; 4) 'Reservoir Characterization,' displaying a 3D geological block model for structural and fracture mapping; 5) 'Exploration & Prospecting,' highlighting target identification on a topographical map; and 6) 'Drilling Optimization & Production,' illustrating an active oil rig drilling into subsurface layers for safe well planning and real-time monitoring

Reliable Seismic Vectorization Solutions

At R2V Technologies, we are committed to delivering accurate, efficient, and cost-effective seismic data vectorization services tailored to the evolving needs of the energy industry.
Our goal is to help organizations unlock the value of legacy seismic records through reliable digital conversion and high-quality geophysical data processing.
Whether you need raster-to-vector seismic conversion, seismic section digitization, or interpretation-ready digital seismic data, our team is ready to provide dependable solutions backed by technical expertise and industry experience.

Our Work
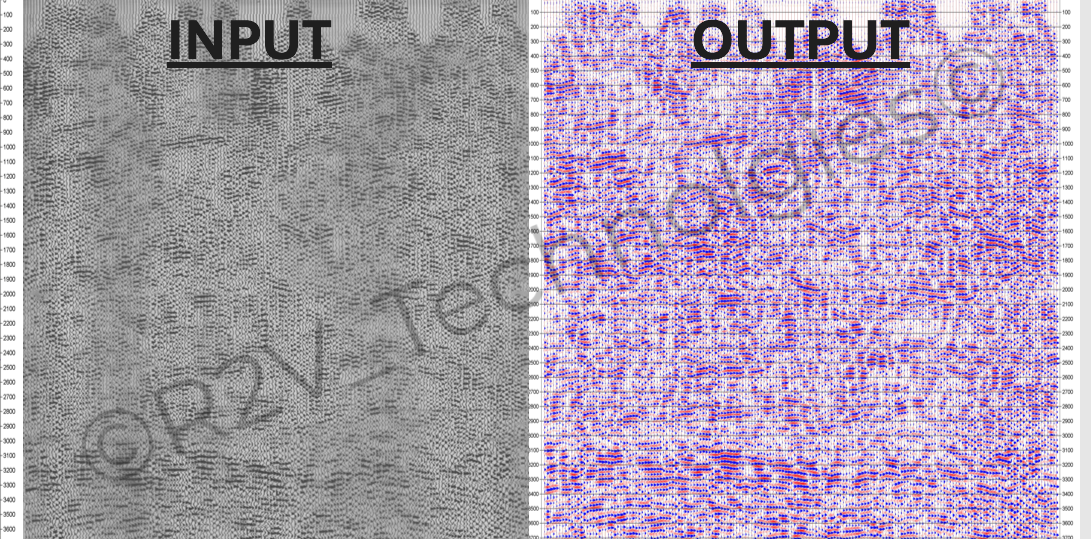
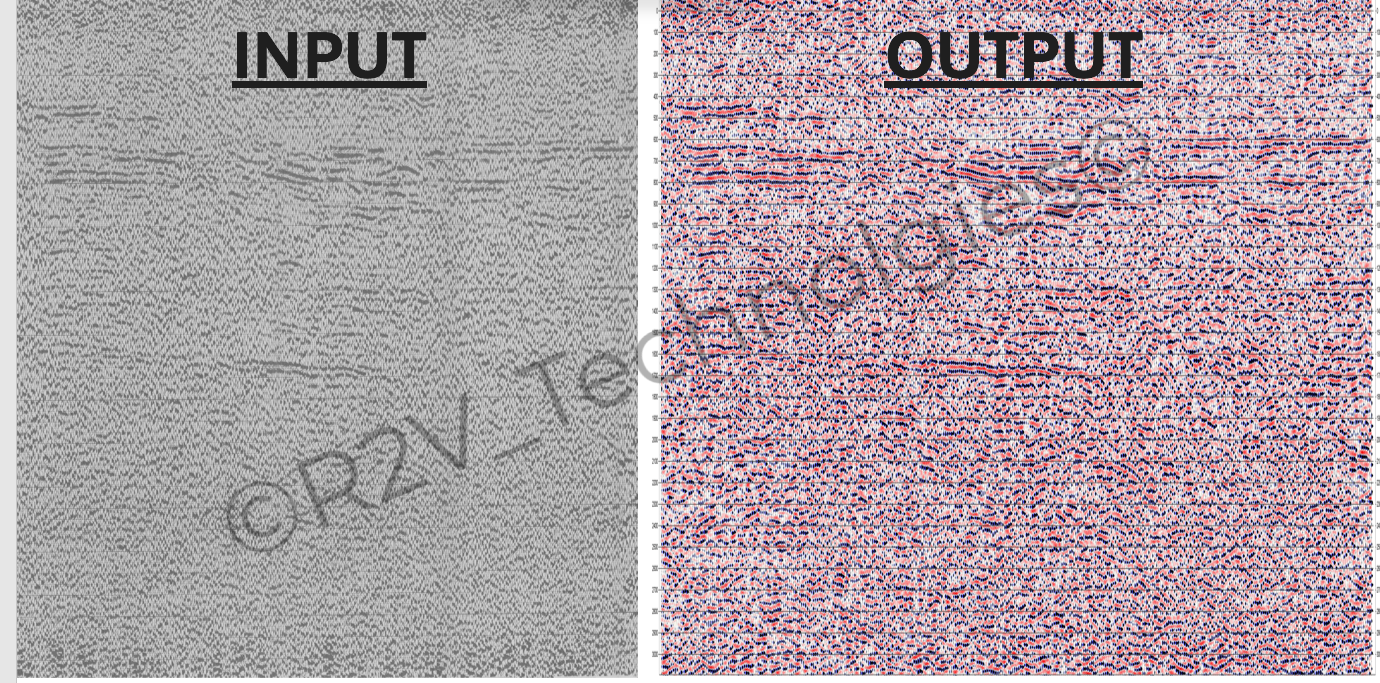
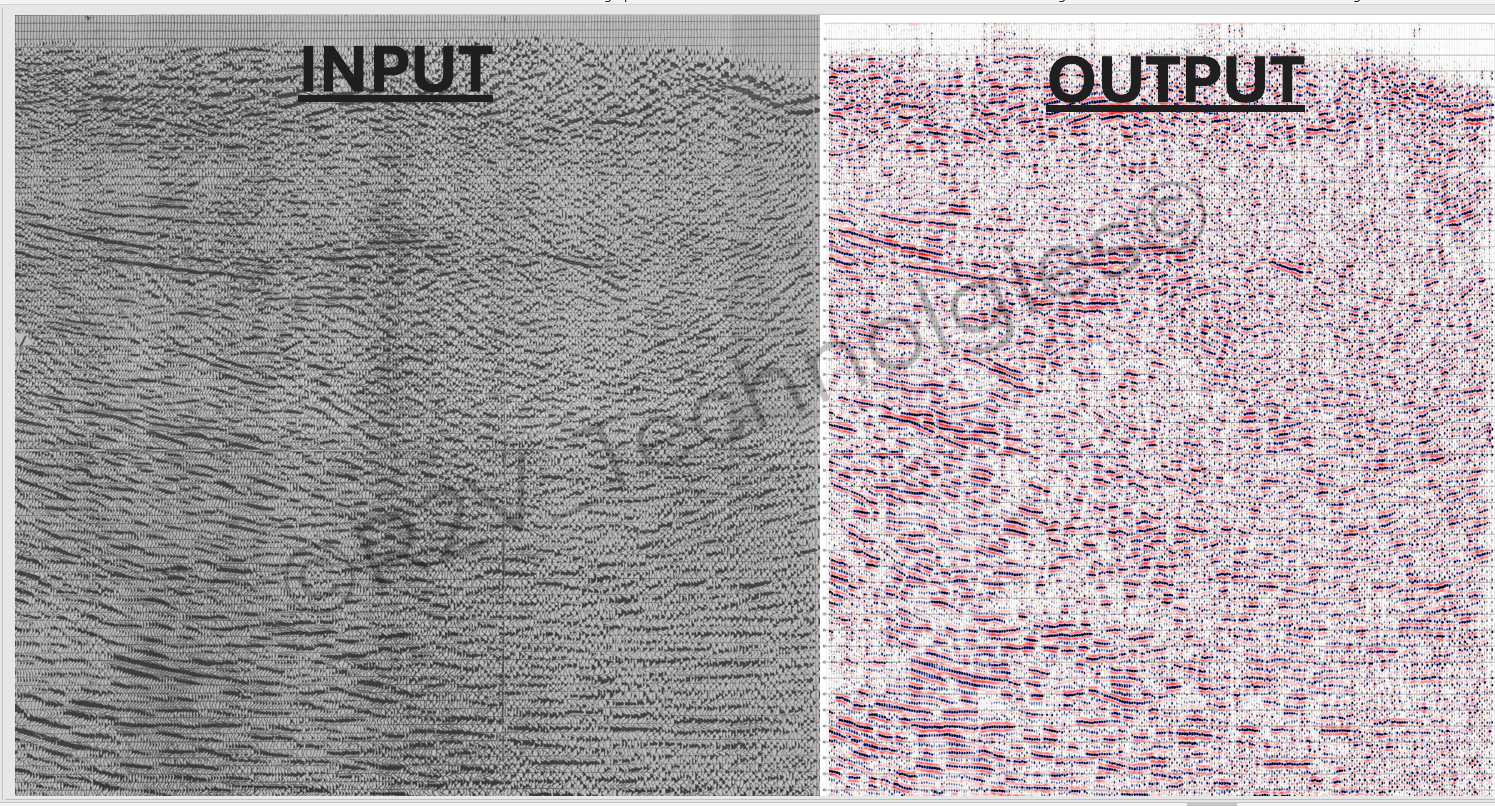
A side-by-side comparison demonstrating seismic data digitization. The left panel, labeled 'INPUT,' displays a scanned, grayscale, analog paper seismic section with dense, slightly noisy wiggle traces. The right panel, labeled 'OUTPUT,' shows the resulting digitized and enhanced data, featuring distinct red and blue traces against a clean white background, highlighting improved clarity and definition of the geological structures. A faint diagonal watermark reading '© R2V Technologies' spans across the image
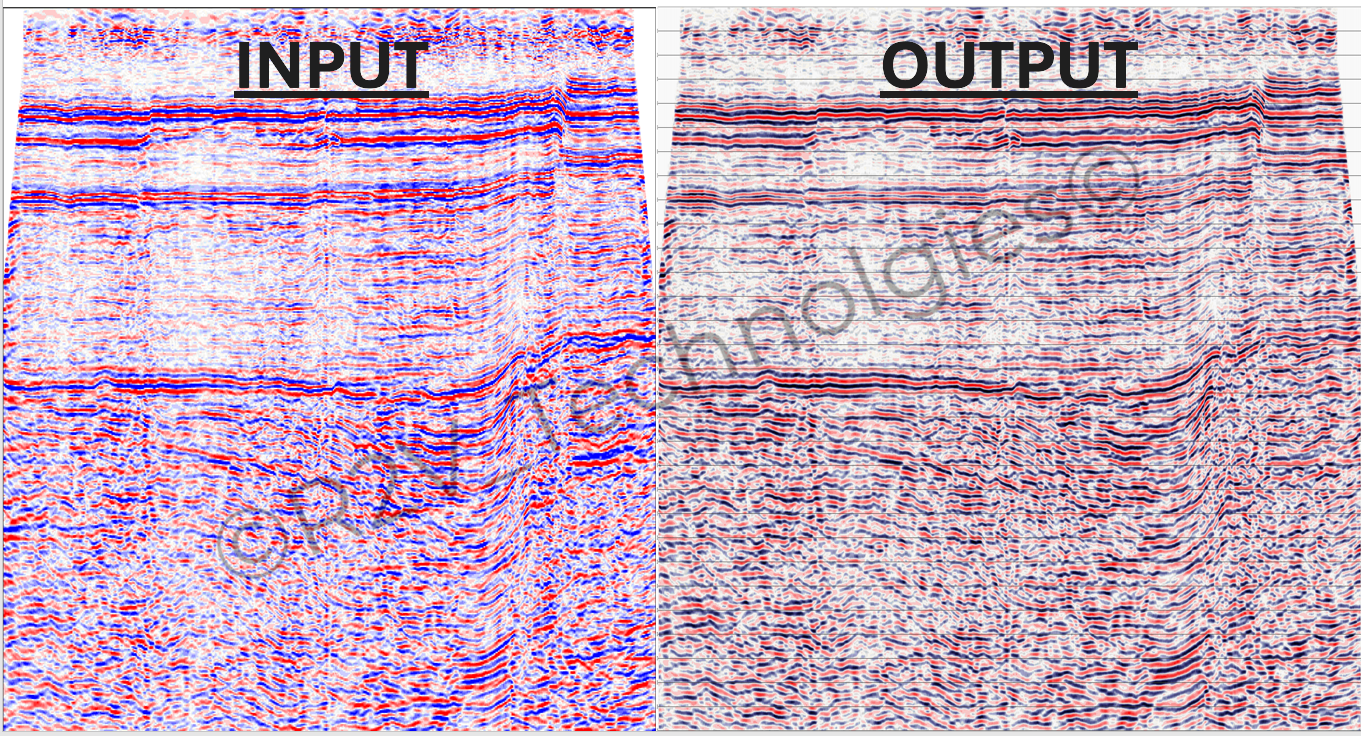
A side-by-side comparison illustrating seismic data digitization and enhancement. The left panel, labeled 'INPUT,' displays a scanned color seismic section with somewhat blurry and noisy red and blue traces. The right panel, labeled 'OUTPUT,' shows the processed digital version with significantly sharper, high-contrast traces, improving the clarity and definition of the subterranean geological layers. A faint diagonal watermark reading '© R2V Technologies' spans across both panels.
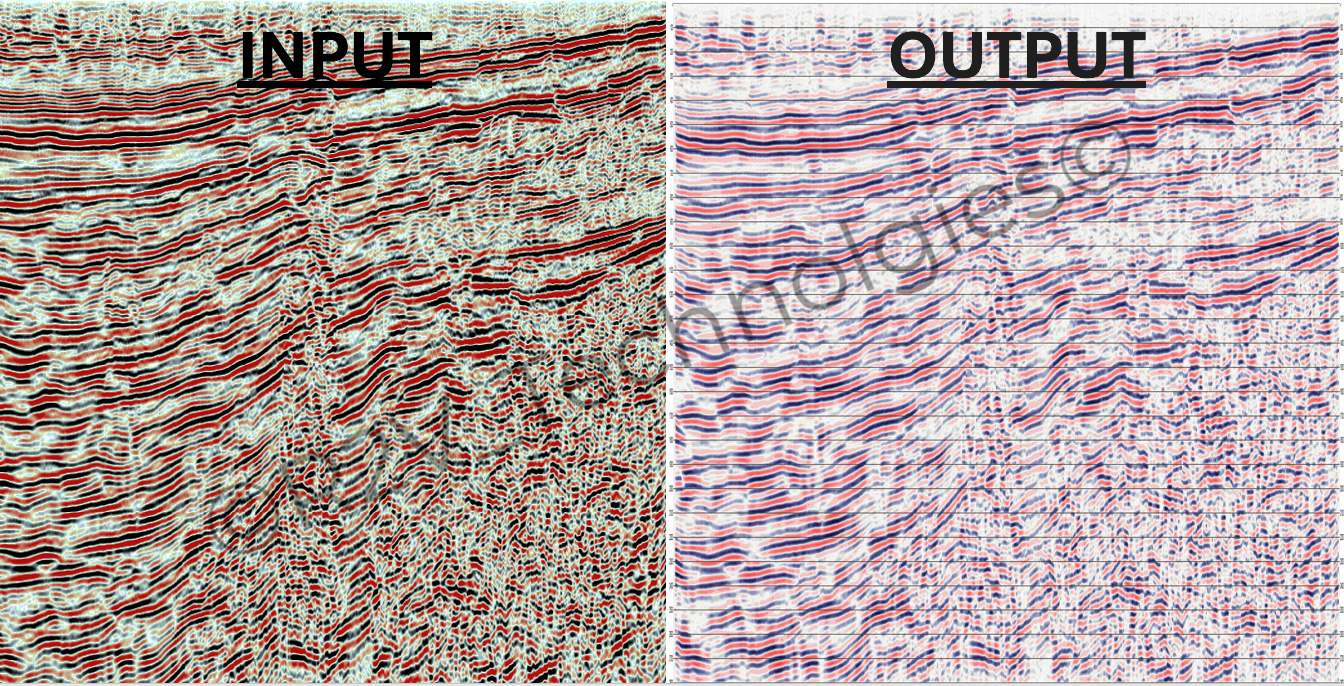
A side-by-side comparison illustrating seismic data digitization and processing. The left panel, labeled 'INPUT,' displays a dense, scanned analog seismic section characterized by thick, high-contrast red and black traces. The right panel, labeled 'OUTPUT,' presents the refined digital result, featuring cleaner red and blue traces superimposed on a horizontal grid, demonstrating enhanced clarity, reduced noise, and better structural definition. A faint diagonal watermark reading '© R2V Technologies' spans across the image.
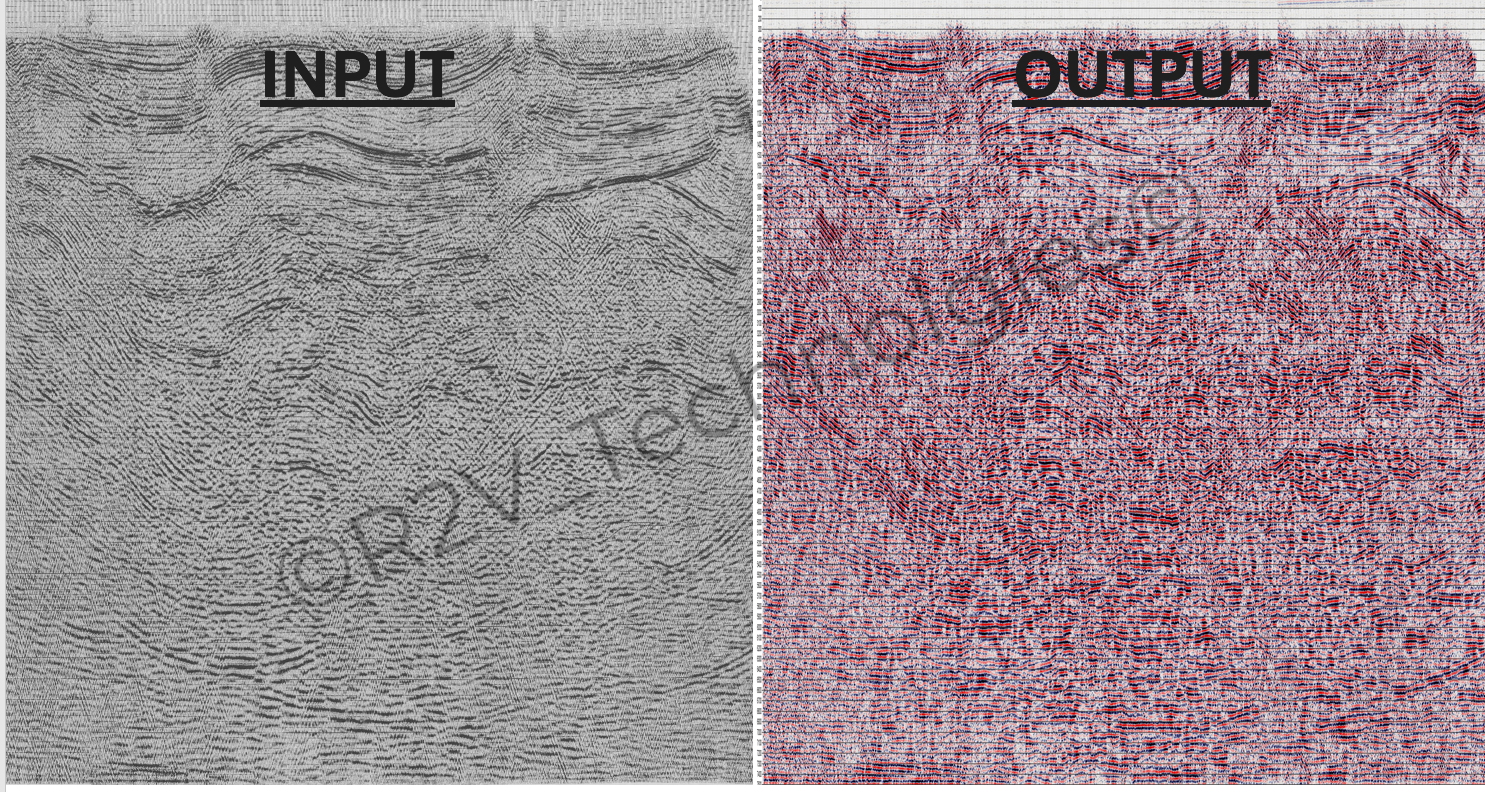
A side-by-side comparison demonstrating seismic data digitization and enhancement. The left panel, labeled 'INPUT,' displays a noisy, low-contrast grayscale scanned analog seismic section. The right panel, labeled 'OUTPUT,' shows the processed digital version featuring distinct red and blue traces, improving the visibility of the horizontal seismic reflectors against the background noise. A faint diagonal watermark reading '© R2V Technologies' spans across the image.