Shot Point Digitization

Shot point digitization refers to the process of converting physical seismic records—such as shot point maps, analog logs, or paper seismic lines—into digital formats for geological software .
It involves taking legacy 2D paper/raster seismic sections and converting them into digital SEG-Y formats. The coordinates of the shot points on the survey line must be extracted from physical base maps and merged with the trace data.

The Process includes :

Map Georeferencing: Shot point numbers and locations are digitized from scanned analog basemaps. Coordinates are calibrated using spatial referencing in a GIS environment.
Seismic Tracing: The raster seismic section is digitized. Specialized auto-trace and vectorization software reads the wiggly trace lines and negative phase signals from the image, preserving amplitude and frequency.
Navigation Merging: The extracted shot point locations (spatial coordinates and CMP data) are merged with the trace data headers to create a fully navigated SEG-Y file.

At R2V Technologies, we specialize in shot point digitization and seismic navigation data conversion. We extract coordinate information from faded paper base maps, old location ledgers, and distorted film to build highly accurate, clean spatial datasets ready for modern interpretation platforms.

Unlike generic data-entry vendors, the team at R2V Technologies understands the geophysics behind the numbers. Our quality assurance checks include testing line intersections for depth/time consistency and verifying shotpoint spacing against original vintage observer logs. We ensure that your reconstructed navigation data matches the physical reality of the original survey layout.

Our Work
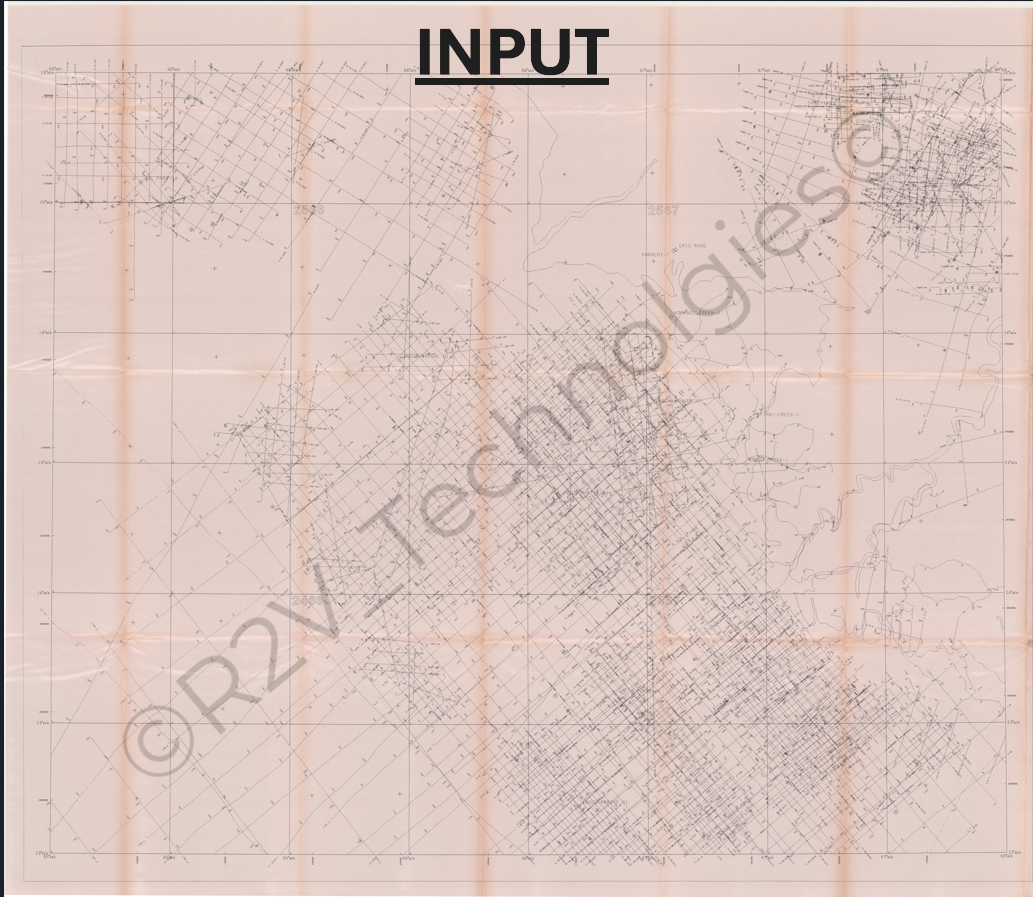
A scanned, sepia-toned vintage seismic shotpoint base map under a grid system overlay. The map features a dense network of crisscrossing straight survey lines, heavily concentrated in the lower-central and top-right sections, marking geographical shotpoint locations. Faint geographic contours, coastlines, or river pathways are visible on the right side of the map. The bold word "INPUT" is centered at the very top. A large, transparent watermark reading "© R2V Technologies" is overlaid diagonally across the entire image
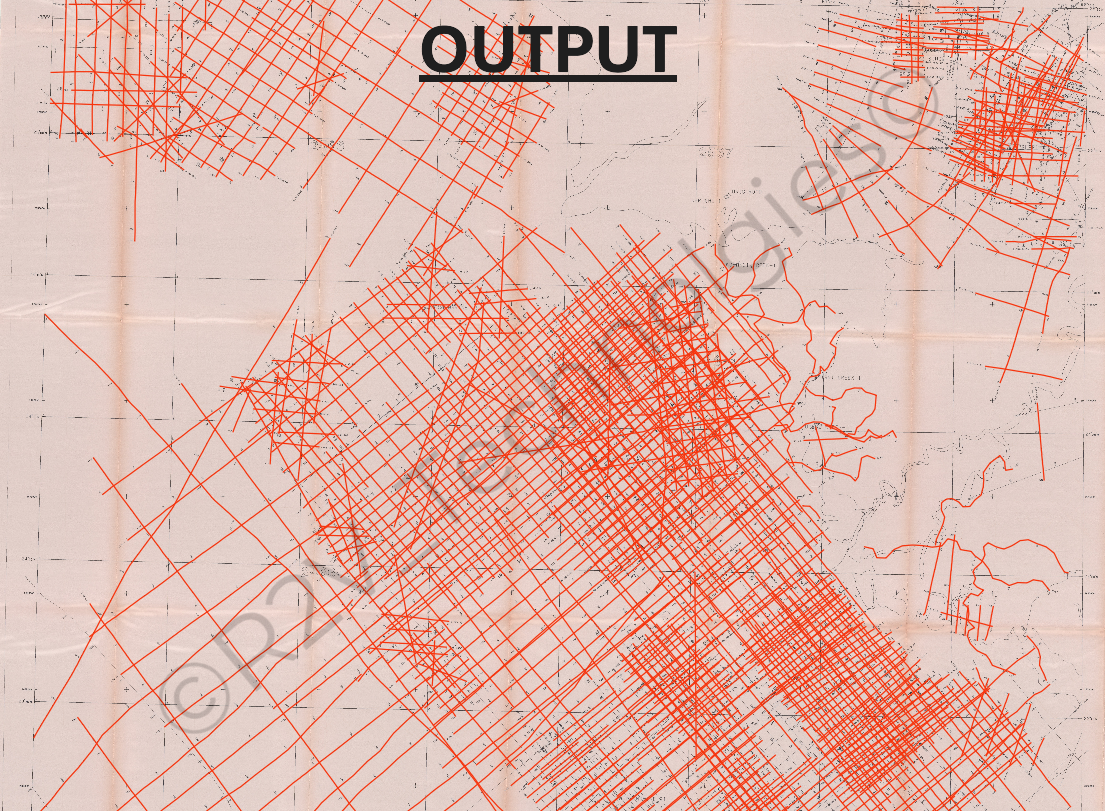
A digitized version of the previous seismic base map, displaying the processed results on a light beige background. The crisscrossing networks of survey lines and geographic coastal contours are now traced clearly in bright orange lines, making the spatial pattern highly distinct. The word "OUTPUT" is printed in large, bold, underlined black text at the top center. A transparent watermark reading "© R2V Technologies" is angled across the entire map interface.

Core Photo Splicing

Core photo splicing refers to the manipulation of digital images by copying, pasting, or combining parts of two or more images into a single composite. This technique is used for creative photo editing, web design, or malicious forgery intended to deceive the viewer.
It is the process of cropping, aligning, and stitching raw core box photographs into a single, continuous, depth-calibrated visual log.
During well log digitization, this spliced image provides a highly accurate, continuous geological baseline to calibrate wireline logs, identify lithologies, and calculate Rock Quality Designation (RQD).

Methodology :
Data selection – To start with , a small representative interval of the core photograph is taken and a classifier is trained to distinguish different lithology classes based on their textural and spectral characteristics . Data selected for initial classifier training should be representative of the entire well, and chosen carefully so that they contain all the potential classes that need to be identified .
Protocol development : can be defined as a set of rules and controlling parameters that are arranged in a sequential order and work together to automate core photograph classification. All parameters that best classify the core photograph, based on the experiments on the core photograph used in this study, are coded as a protocol.
Image segmentation : This is a process of partitioning an image into nonoverlapping regions. A multi-resolution segmentation algorithm is used for image segmentation, which is a region-merging technique that starts with single-pixel objects.
Knowledge-base design : It is used to define possible classes present in the core photograph. In this scheme, an expert trains a suitable classification algorithm by selecting representative objects for each class and defining features that could distinguish objects belonging to various classes.
Image classification : Classification is a process of assigning each segmented object to appropriate classes (lithology in this case) . The principle of image classification is that each object is assigned to a class based on its characteristic features, by comparing it to the predefined feature ranges in the feature space.

At R2V Technologies, our core photo splicing services digitally eliminate these gaps. We reconstruct individual slabbed or whole-core photographs into a single, high-resolution, depth-registered vertical composite. This provides geoscientists with an uninterrupted, workstation-ready view of the entire cored well interval.

Why Outsource Core Photo Splicing to R2V Technologies?

Geological Awareness: Our data technicians are trained to distinguish between natural structural fractures (faults, stylolites) and drilling-induced mechanical breaks, ensuring natural features are never spliced out.

Workstation Ready: We don’t just deliver an image; we deliver a georeferenced dataset that loads instantly into your existing petrophysical interpretation suites.

Scalable Data Rooms: Turn dusty physical archives into interactive digital assets for joint ventures, asset divestitures, and remote technical reviews.

Our Work
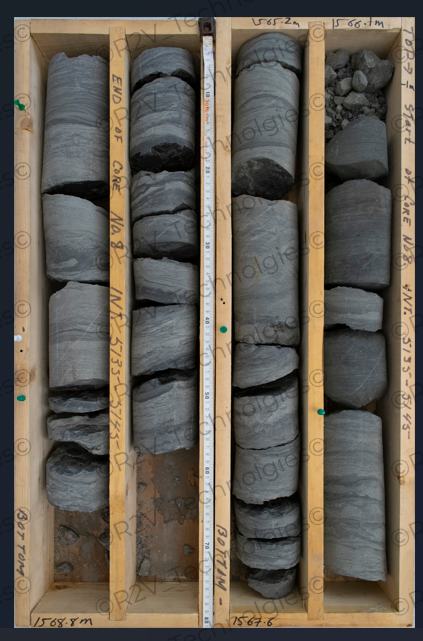
A high-angle, vertical photograph of a wooden core box containing four rows of cylindrical geological rock core samples. The cores are primarily a matte grey color with visible fine sedimentary bedding and laminations. A white measuring tape runs vertically down the center channel separating the left two rows from the right two rows. Hand-written notations on the wooden dividers indicate depths and labels, including "TOP -> Start of Core No. 8. INT. 5135'-5145'" on the far-right panel, "1565.2m" and "1566.1m" at the top of the center-right channels, and "END OF CORE No. 8 INT. 5135'- 5145'" down a left divider. The bottom of the box has depth labels like "1568.8m" and "1567.6", alongside the word "BOTTOM" written vertically. The top of the rightmost row contains small, fragmented rubble before transitioning into solid cylindrical pieces, while the other segments show intact core segments broken horizontally at irregular intervals
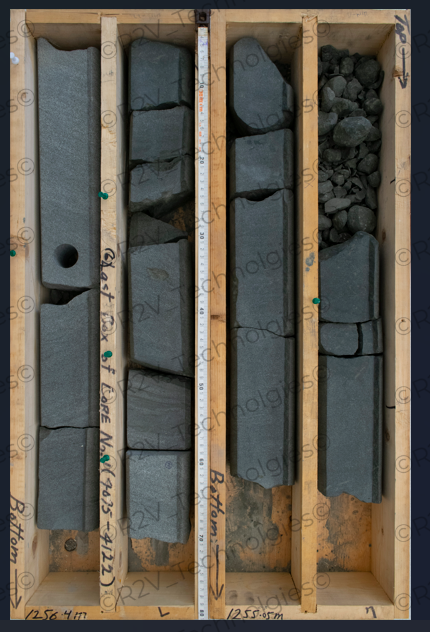
A top-down, vertical photograph of a wooden core tray containing four rows of dark grey sedimentary geological rock core samples. The cores show smooth, cylindrical outer faces with faint internal lamination patterns. A white tape measure is positioned vertically down the center wooden divider. The rightmost channel begins at the top with heavily fractured, rubbly gravel pieces before transitioning into solid core segments further down. In the leftmost row, a distinct circular plug-hole has been drilled out for sampling. Handwritten text on the wooden dividers includes "Top ->" at the top right, "Bottom ->" near the bottom center and left edges, and a vertical inscription reading "Last box of core No. 7 (4075-4122)". Depth marks such as "1256.4 m" and "1255.05 m" are written at the base of the channels. A transparent watermark reading "© R2V Technologies" is tiled diagonally across the entire image.
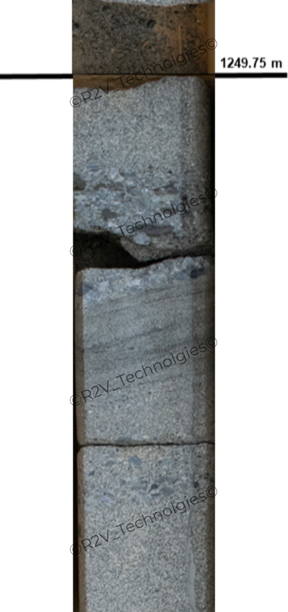
A close-up, vertical view of a geological core sample inside a vertical channel. The sample is divided by a prominent horizontal black line near the top, labeled on the right with the depth marker "1249.75 m". Above this line, a small portion of dark, highly fragmented gravel-like rock is visible. Below the line, the core sample consists of several larger, intact cylindrical blocks of textured grey sedimentary rock. The rock sections show internal variations, including a layer with distinct pebble-like clasts, a middle section with fine horizontal sedimentary bedding bands, and a lower speckled grey section containing embedded dark fragments. A semi-transparent watermark text reading "© R2V Technologies" is tiled diagonally across the length of the sample.

Seismic Field Record Digitization

Seismic record field digitization refers to the process of converting analog voltage signals from field geophones into discrete digital counts using an Analog-to-Digital Converter (ADC).
This crucial step allows seismologists to apply modern digital signal processing, filter out noise, and store data in standard formats like SEG-Y.

The Digitization Process :

Analog to Digital: Continuous voltage outputs from field sensors (geophones) are sampled at specific intervals and converted into binary digital values.
Sampling Rate: Defines how many times per second the signal is recorded (e.g., 500 Hz or 1000 Hz). The sampling rate must perfectly respect the Nyquist theorem to prevent aliasing.
Resolution: Modern data acquisition systems utilize 24-bit ADCs, providing a high dynamic range to capture both minuscule micro-seisms and massive ground motions.

At R2V Technologies, we provide professional seismic field record digitization services designed to transform aging seismic documents into accurate, structured, and analysis-ready digital datasets.
Our experienced digitization specialists use advanced vectorization and data extraction techniques to ensure maximum precision and consistency.
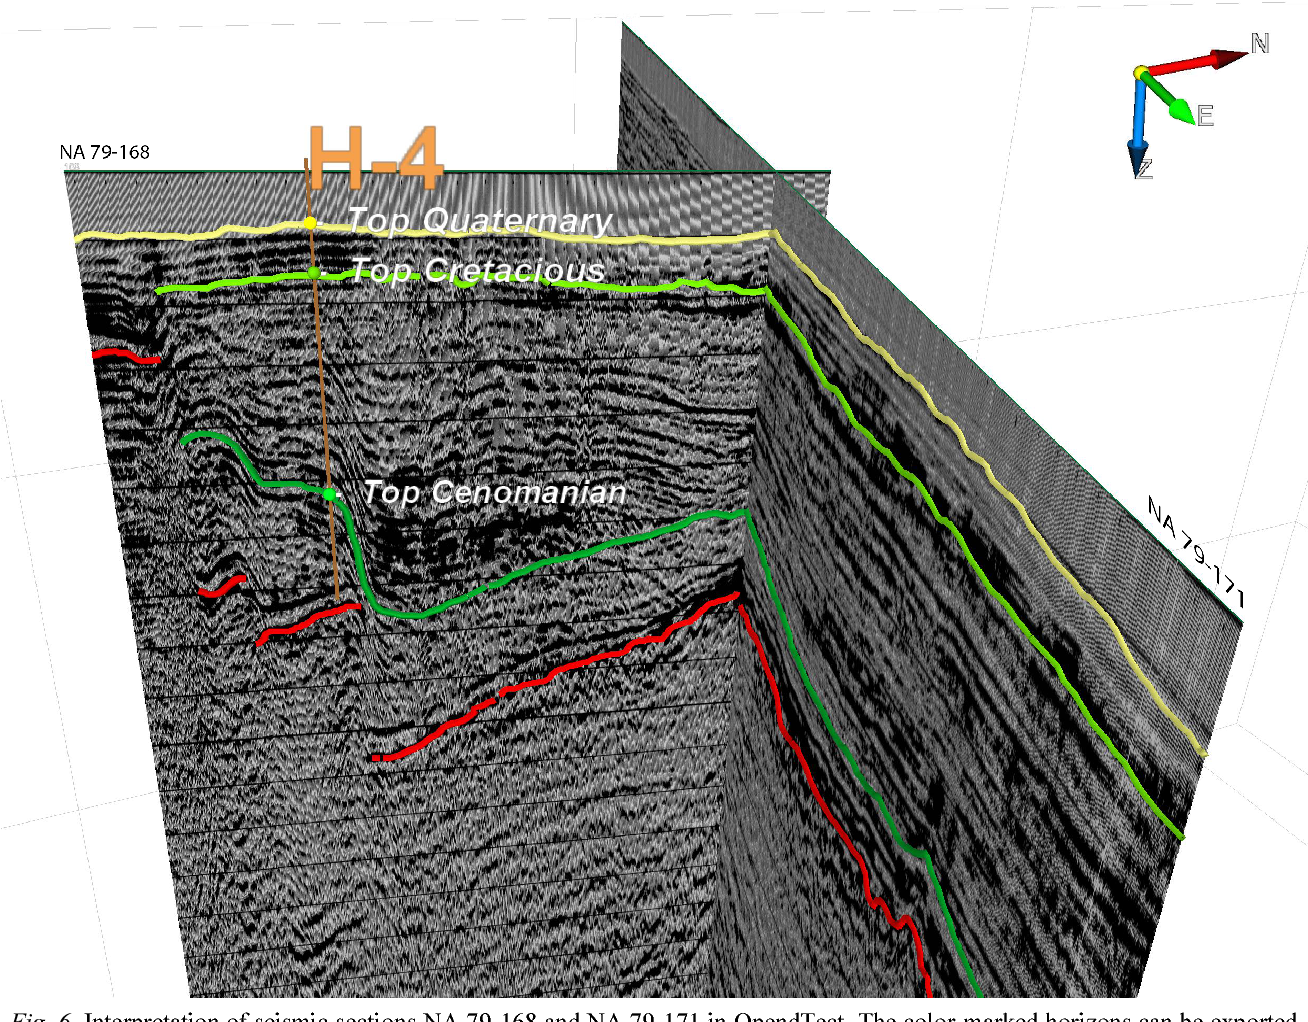
A 3D geological visualization of two intersecting seismic interpretation profiles, labeled "NA 79-168" on the front-facing plane and "NA 79-171" on the right-angled plane. The black-and-white seismic cross-sections display layered subsurface textures. Key geological horizons are traced with continuous colored lines across both sections: a yellow line labeled "Top Quaternary" near the surface, a bright green line labeled "Top Cretaceous" below it, a darker green line labeled "Top Cenomanian" showing a prominent downward dip or fault structure, and discontinuous red lines marking a deeper horizon. A vertical orange line labeled "H-4" represents a borehole well path, intersecting the horizons with colored marker dots. In the top right corner, a 3D orientation axis arrow points North (red arrow N), East (green arrow E), and Down (blue arrow Z). A partial figure caption at the bottom reads, "Fig. 6. Interpretation of seismic sections NA 79-168 and NA 79-171 in OpendTect. The color-marked horizons can be exported.".

Our Work

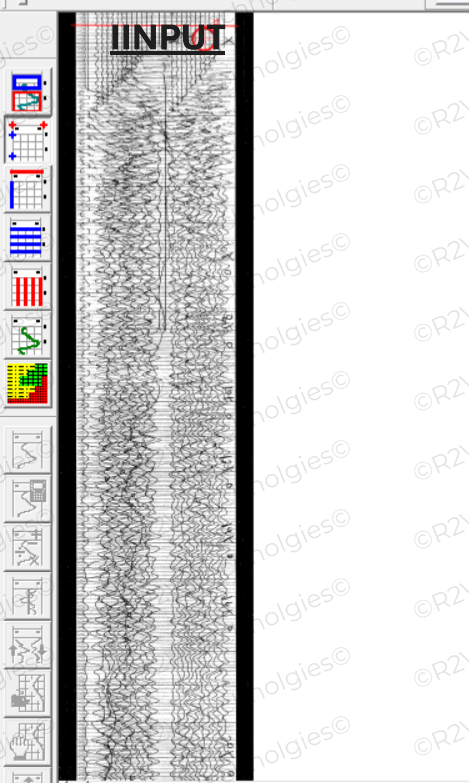
A user interface of a specialized geological or seismic software program featuring a long, vertical window containing complex, black-and-white seismic trace data. The vertical plot shows overlapping, undulating wiggle curves spanning from top to bottom. At the very top of this data window, the word "IINPUT" is superimposed in bold black text, with a thin red line drawn horizontally above it. On the left side of the screen, a vertical toolbar contains multiple square, clickable application icons with various colorful diagrams, lines, grids, and tool symbols used for data analysis and editing
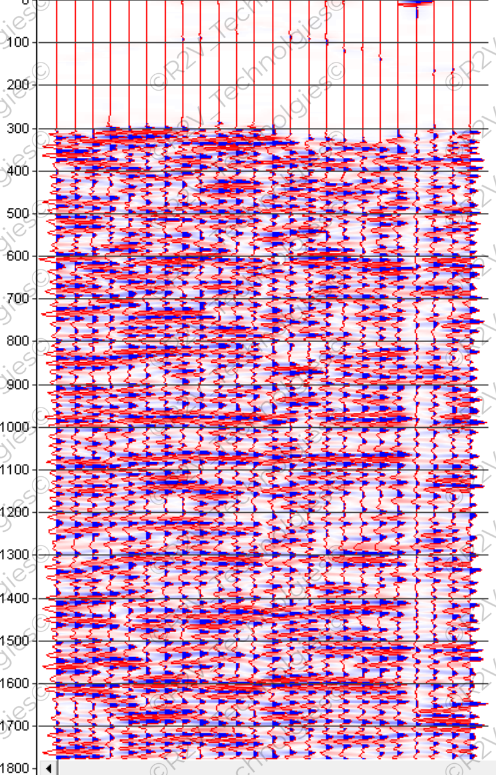
A vertical seismic data plot displaying a dense array of seismic wiggle traces. The vertical axis on the left represents depth or time, with horizontal grid lines marked at intervals from 100 down to 1800. The upper portion of the chart (from 0 to 300) shows mostly straight, quiet vertical red lines. Below the 300 mark, the data fills with highly active, repeating horizontal waves or wiggles outlined in red, with the peaks and troughs filled with alternating blue and red shading, creating a complex, textured pattern across the entire profile. A faint, repeating watermark text reading "© R2V Technologies" is visible across the background of the chart

Drilling Information Digitization

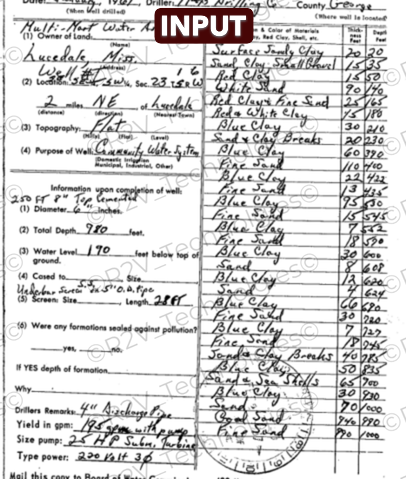
A scanned, black-and-white historical water well driller's log form, filled out with handwritten cursive details. The left half of the document provides general well data, containing entries such as "Lucedale, Miss.", "Well #1", "Purpose of Well: Community Water System", and details about the depth, screen size, and pump specifications. The right half features a structured table listing the geologic materials and depths encountered during drilling, including rows for "Surface Sandy Clay", "Red Clay", "White Sand", and "Blue Clay", accompanied by columns for thickness and depth in feet. At the top center, a dark brown rectangular badge with rounded corners displays the word "INPUT" in bold white capital letters. A transparent watermark reading "© R2V Technologies" is tiled diagonally across the entire form
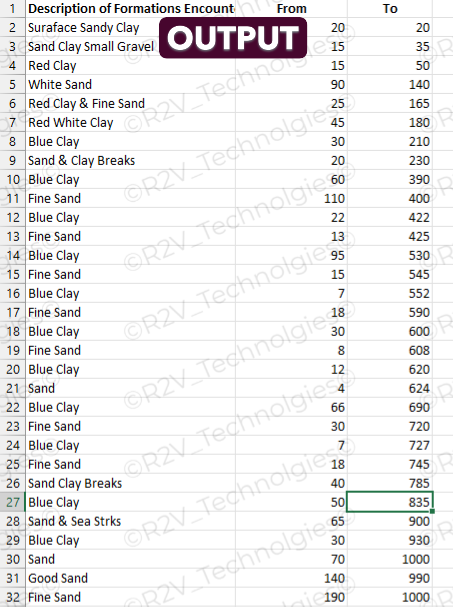
A spreadsheet data table containing a geological formation log with three columns titled "Description of Formations Encount", "From", and "To". The spreadsheet features 32 numbered rows tracking different subsurface soil layers, including labels like "Surface Sandy Clay", "Red Clay", "White Sand", "Blue Clay", and "Fine Sand", along with their corresponding depth intervals. Near the top center, a dark purple rectangular badge with rounded corners displays the word "OUTPUT" in bold white capital letters. A faint, repeating watermark reading "© R2V Technologies" is visible diagonally across the background grid lines of the spreadsheet.

Tadpole Digitization

A Dipmeter is a specialized wireline well logging tool used to measure the angle (magnitude) and direction (azimuth) of subsurface rock layers. By identifying the dip of geological formations, it helps geologists map underground structures, trace sedimentary environments, and detect faults or folds.

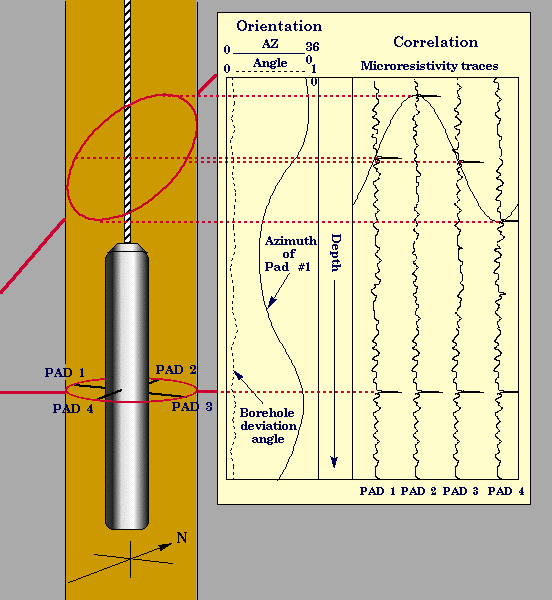
The determination of dip angle and direction of a planar surface requires the elevation and geographical position of at least three points. Dipmeter tools achieve this result by measuring some sensitive formation parameter by means of three or more identical sensors mounted on caliper arms so as to scan in detail different sides of the borehole wall.

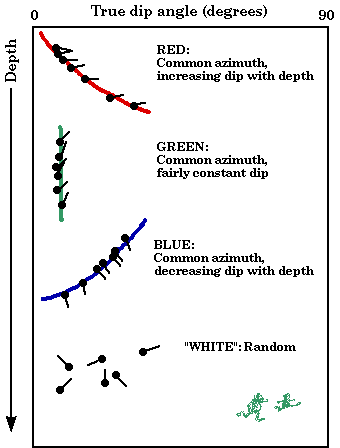
The most common presentation of dipmeter data is the arrow or tadpole plot, which is two-dimensional representation of a three-dimensional quantity .

At R2V Technologies, we provide professional tadpole digitization services tailored to the needs of oil & gas companies, geological survey organizations, mining companies, and geophysical consultants. Our experienced digitization team converts paper-based tadpole diagrams and analog records into structured digital datasets with high precision and quality control.
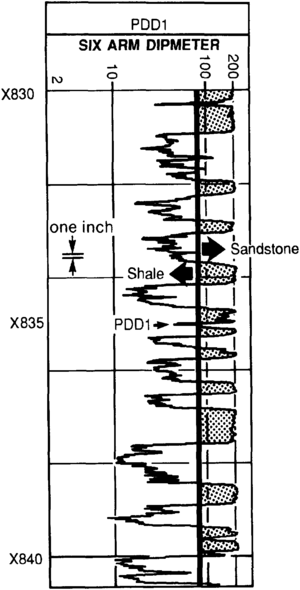
A vertical, black-and-white geological well log chart labeled "PDD1" and "SIX ARM DIPMETER". The chart features a scale at the top ranging from 2 to 200, with depth intervals marked along the left margin from X830 down to X840. A jagged curve line traces data values vertically through the center. On the right side of the track, distinct stippled (dotted) pattern blocks indicate geological formations, with arrows pointing to specific zones labeled "Sandstone" (pointing right to a dotted block) and "Shale" (pointing left to a narrow section). A small indicator on the left shows a scale measurement for "one inch", and a central arrow points to a specific data spike labeled "PDD1".
A geological diagram demonstrating how a dipmeter logging tool measures rock layer orientation inside a borehole. Left Side (Borehole Diagram): A cylindrical logging tool is suspended by a wireline cable within an orange-shaded vertical borehole. Four measuring pads (labeled PAD 1, PAD 2, PAD 3, and PAD 4) extend horizontally from the tool against the borehole wall. An angled, tilted red ellipse above the tool represents a dipping geological boundary layer. Red dotted lines project horizontally from points along this dipping plane over to the data charts on the right. At the bottom, a directional compass arrow points North (N). Right Side (Data Logs): Displays two main charts aligned with a downward-pointing "Depth" axis. Orientation Chart: Shows a dashed line for "Borehole deviation angle" and a wavy solid curve tracking the "Azimuth of Pad #1" against a top scale of 0 to 36 for Azimuth (AZ) and 0 to 1 for Angle. Correlation Chart: Titled "Microresistivity traces," it plots four separate vertical, jagged line readings corresponding to PAD 1, PAD 2, PAD 3, and PAD 4. A sinusoidal curve passes through distinct peak offsets across these four pad traces, illustrating how the depth delay between each pad's reading is used to calculate the formation's dip angle and direction.
A diagram illustrating structural dip patterns using tadpole plots, plotted against Depth on the vertical axis (increasing downward, shown by a long arrow on the left) and True Dip Angle in degrees on the horizontal top axis (ranging from 0 to 90). The diagram is categorized into four distinct colored patterns: RED: At the top, a series of tadpoles follow a downward-curving red line, with the text "RED: Common azimuth, increasing dip with depth." GREEN: Below that, a vertical group of tadpoles lines up along a straight green vertical line, labeled "GREEN: Common azimuth, fairly constant dip." BLUE: Below the green pattern, a series of tadpoles follow an upward-curving blue line, labeled "BLUE: Common azimuth, decreasing dip with depth." "WHITE": Near the bottom, a scattered, disorganized group of tadpoles is labeled '"WHITE": Random.' In the very bottom right corner, there is a small, playful green illustration of two actual frogs or tadpoles

Our Work

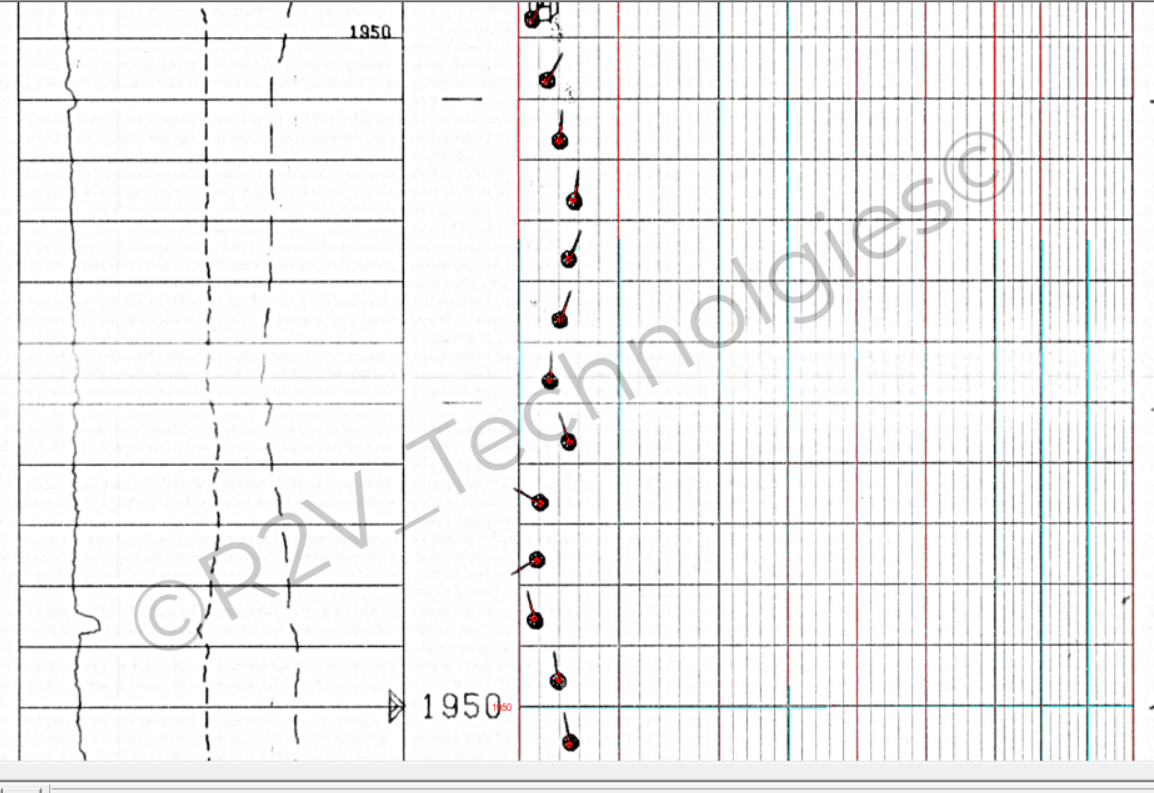
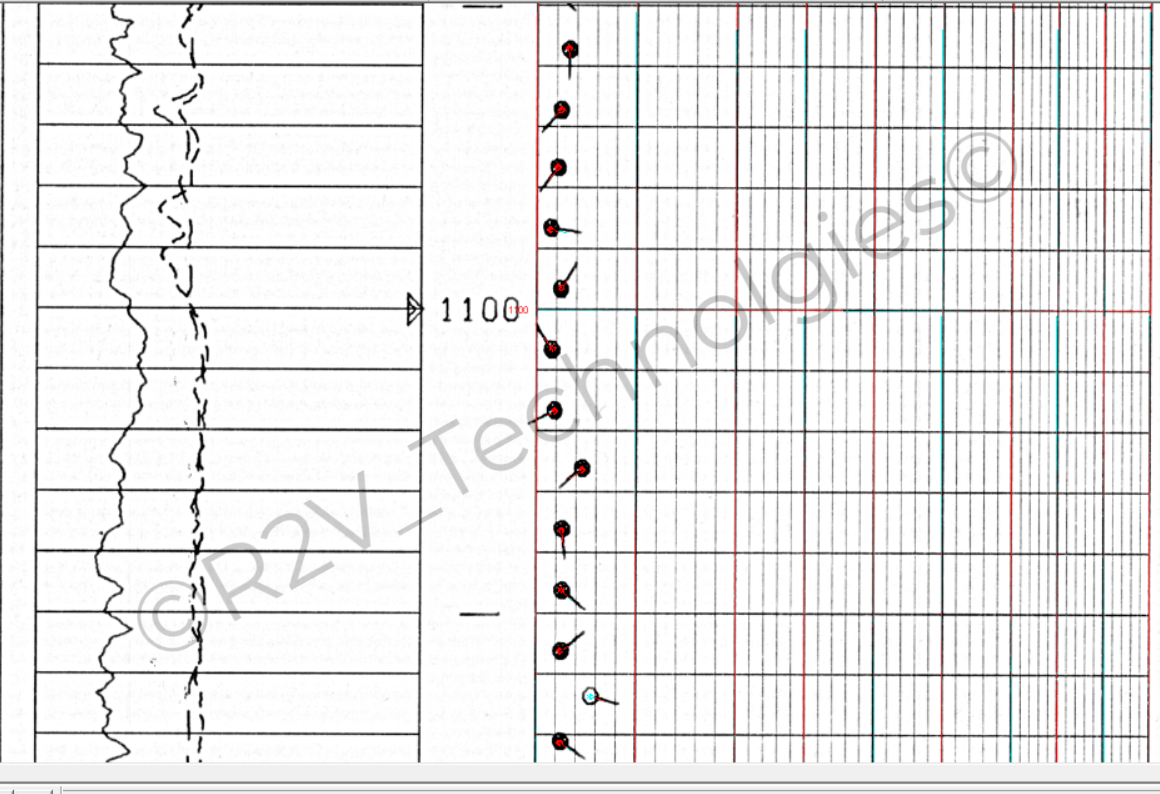
A close-up view of a digital geological well log plot, focusing on a dipmeter log section. The image is split into two primary vertical tracks. The left track features horizontal depth grid lines with two continuous vertical curves—one solid and one dashed—tracing formation properties. An arrow next to the number "1100" marks a specific depth interval. The right track consists of a detailed grid with vertical logarithmic-style lines. Plotted vertically down this track is a series of dip tadpole symbols, mostly represented by red circular heads with small black tails pointing in various directions to denote geological dip angle and direction. One tadpole near the bottom stands out with a light blue head. A semi-transparent watermark reading "© R2V Technologies" is angled across the center of the chart.

Header Capturing

Header capturing in well logging is the process of extracting critical metadata from the header section of a physical or scanned well log and converting it into a standardized digital format, such as an LAS, ASCII, or Excel file.

LAS Header includes :

Well name
API No.
Service company
Client
Country and State name
County
Field name
Location and other drilling information .
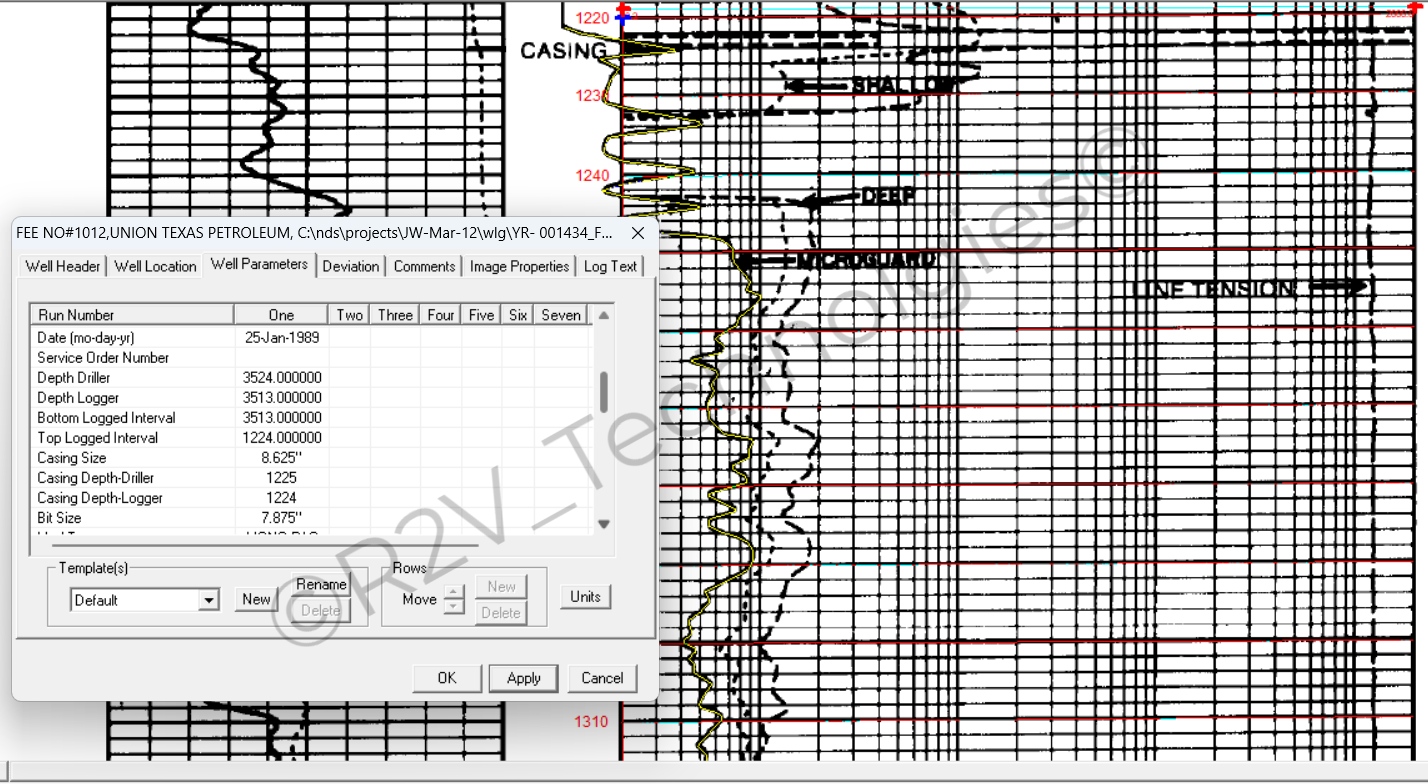
A software application interface window superimposed over a digital borehole log chart. The window is titled with file and project info including "UNION TEXAS PETROLEUM" and has the "Well Parameters" tab active. It displays a data table for "Run Number One" with details such as Date (25-Jan-1989), Depth Driller (3524.000000), Depth Logger (3513.000000), Top Logged Interval (1224.000000), Casing Size (8.625"), and Bit Size (7.875"). Below the table are configuration options for templates and rows, and "OK", "Apply", and "Cancel" buttons at the bottom. In the background, the log chart shows grid lines, depth markers around 1220 to 1310, and multiple squiggly data curve lines labeled with terms like "CASING", "SHALLOW", "DEEP", "MICROGUARD", and "LINE TENSION". A faint watermark reading "© R2V Technologies" is visible across the center.