Well Log Data digitization

Accurate Well Log Digitization Solutions for the Oil & Gas Industry

At R2V Technologies, we provide professional Well Log Digitization services designed to convert legacy hard copy and raster well log data into precise digital formats for modern geological and petrophysical interpretation.
Well log digitization is the process of transforming analog well logs such as paper records, films, scanned images, and raster files into industry-standard digital data formats like LAS (Log ASCII Standard).
This conversion enables efficient subsurface evaluation, reservoir characterization, formation analysis, and geological modeling using modern interpretation software. With decades of geophysical expertise, our team delivers high-accuracy digitization solutions for oil & gas companies, geoscientists, exploration teams, and data management organizations worldwide.

Our Well Log Digitization Expertise

R2V Technologies specializes in converting all types of legacy well log data into interpretation-ready digital formats while maintaining high levels of accuracy and quality control.

We digitize:
Paper well logs
Microfiche well logs
Film-based logs
Raster log images
Scanned PDF logs
TIFF, JPEG, BMP, and grayscale images
Legacy digital well log files
Our technical team can process both clean and challenging source materials, including warped, stretched, faded, and low-quality images.
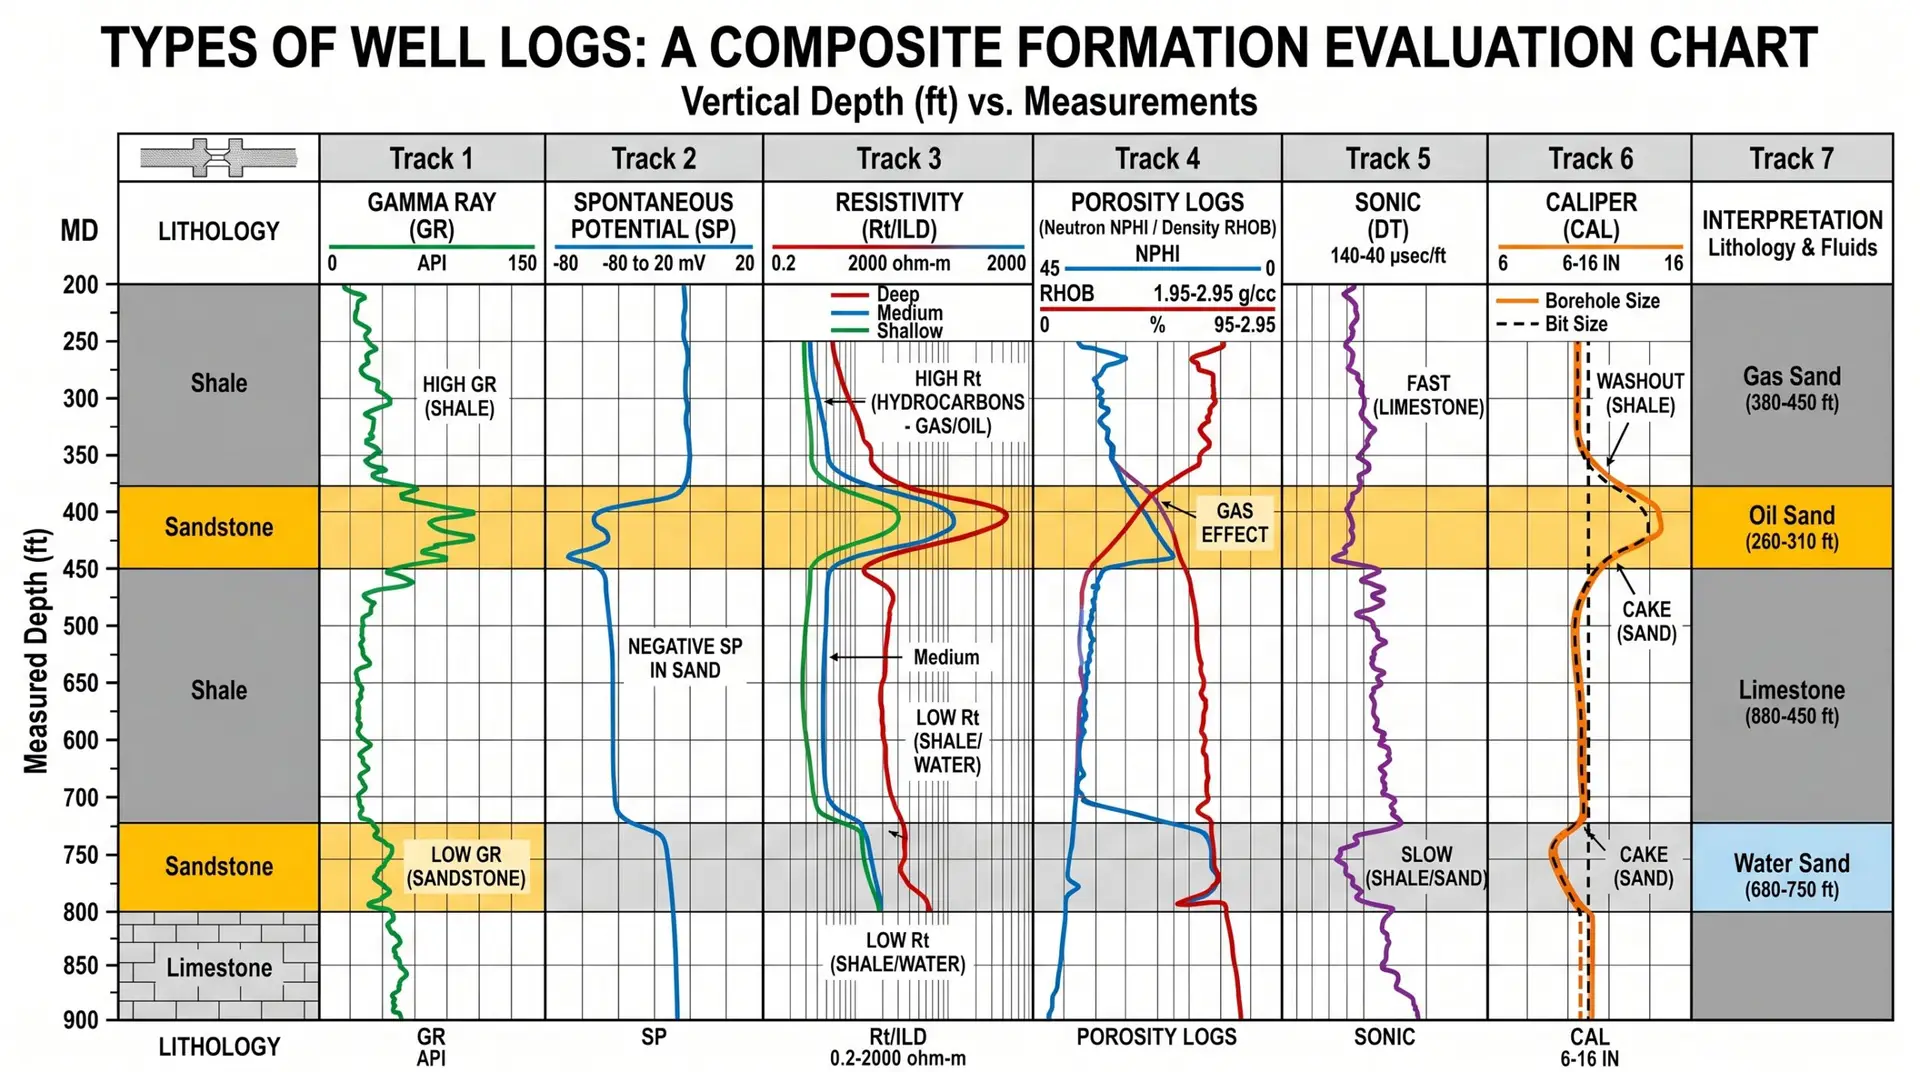
A detailed technical diagram titled 'TYPES OF WELL LOGS: A COMPOSITE FORMATION EVALUATION CHART,' mapping 'Vertical Depth (ft) vs. Measurements' from 200 to 900 feet. The chart is divided into seven vertical tracks displaying different geophysical logging measurements alongside structural lithology and fluid interpretations. The distinct tracks feature curves for Gamma Ray (GR), Spontaneous Potential (SP), Resistivity (Deep, Medium, Shallow), Porosity Logs (Neutron and Density), Sonic, and Caliper. Text annotations highlight specific log responses characteristic of different geological formations, such as high gamma ray readings in shale, negative SP in sandstone, high resistivity indicating hydrocarbons in an 'Oil Sand' layer, a 'gas effect' crossover in the porosity track, and borehole washouts versus mud cake in the caliper track. The rightmost track synthesizes these readings to interpret the subterranean layers as Gas Sand, Oil Sand, Limestone, and Water Sand.

Supported Input Formats

We accept a wide range of industry-standard input formats for well log conversion, including:

PDF
TIFF
JPEG
BMP Black & White Images
Grayscale Images
Color Log Images
LIS Files DLIS Files
LAS Files
ASCII Data Files
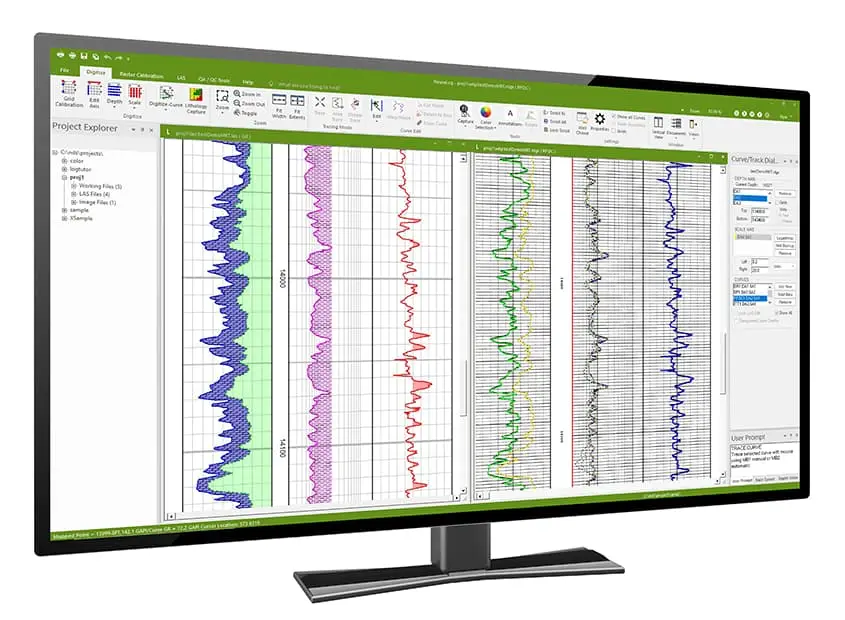
A widescreen computer monitor displaying specialized well log digitization software. The interface shows multiple vertical tracks containing colorful, wavy geological data curves, alongside a project explorer menu, curve settings, and top toolbars for digitization and calibration

Output Formats Delivered

Our digitized well log data is delivered in industry-standard electronic formats compatible with major petrophysical and geological interpretation software. Output formats include:

LAS 2.0
LAS 1.2
CWLS Log
ASCII Standard
ASCII PETRA
ASCII
LBS Format
Customized Client-Specific Formats.
All output files undergo strict quality checks to ensure curve accuracy, depth consistency, and reliable data integrity.
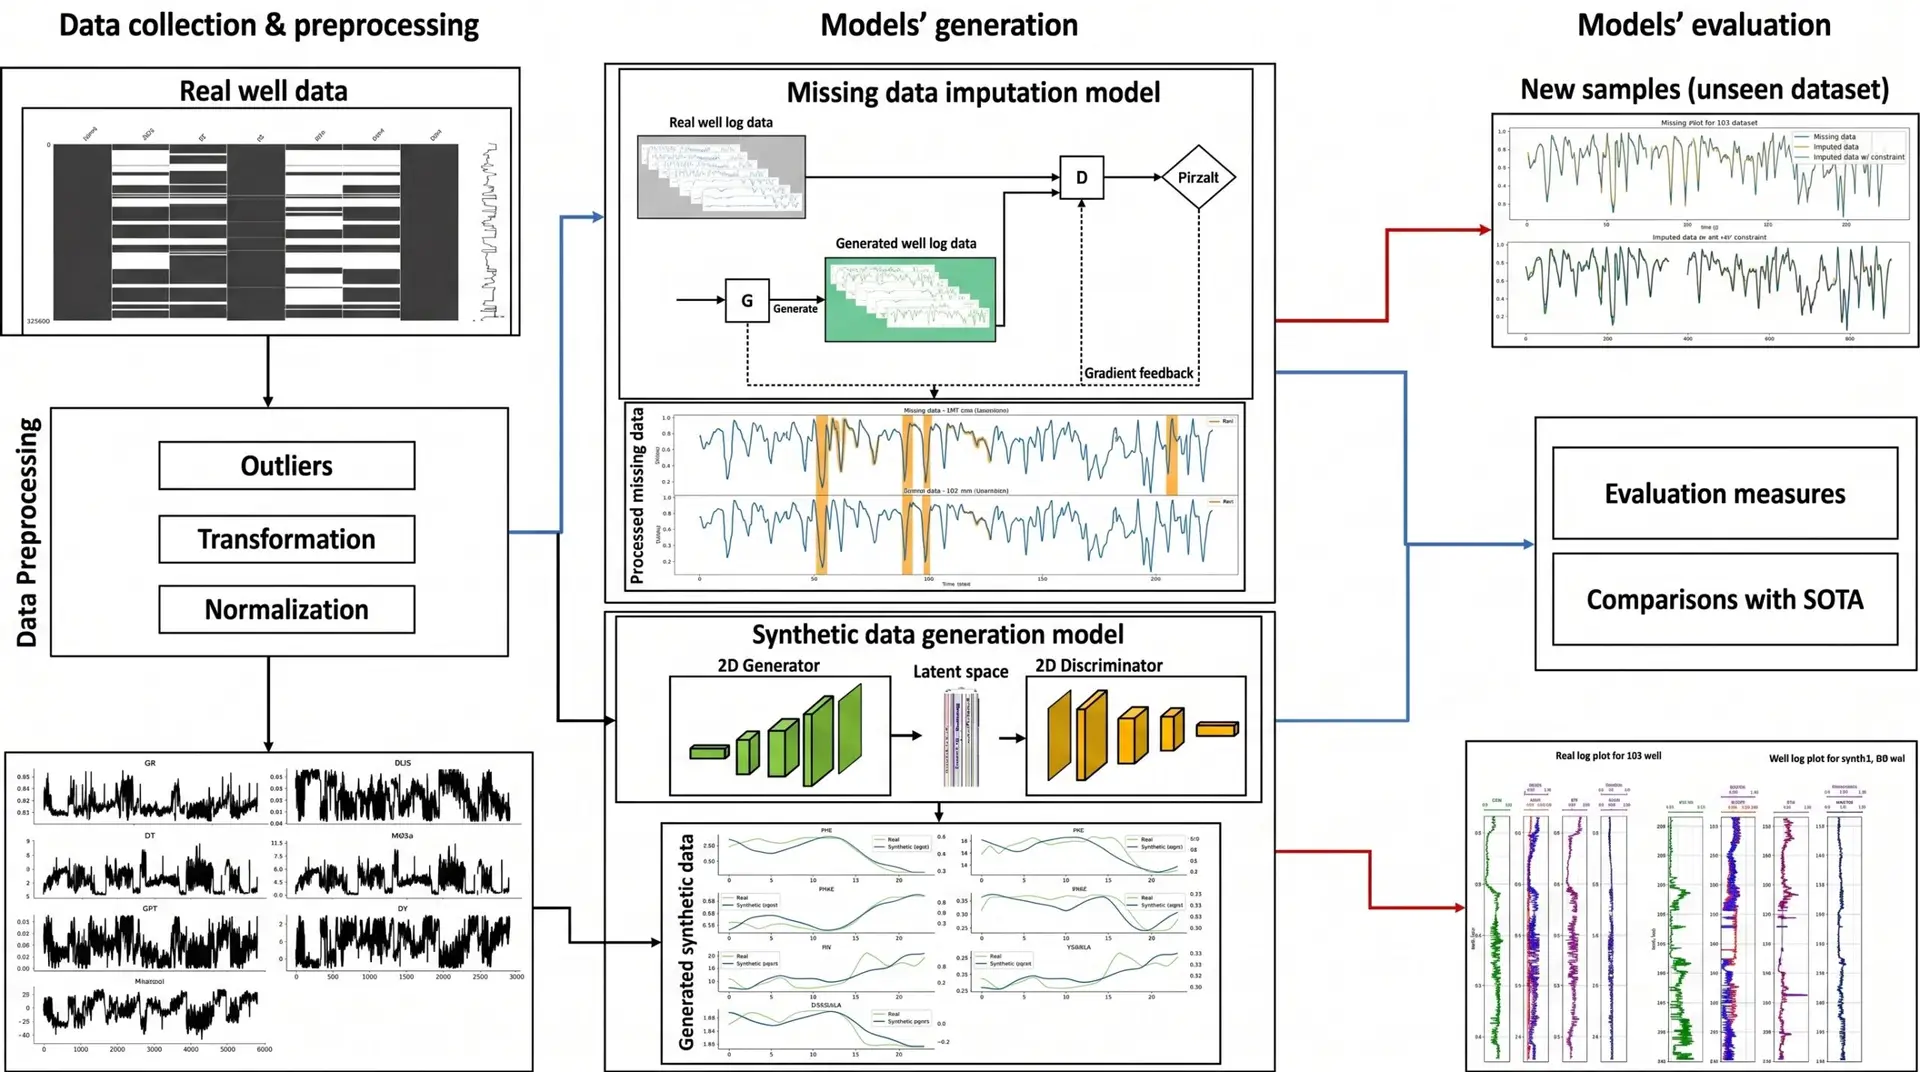
A detailed flowchart illustrating a machine learning pipeline for well log data, divided into three main stages: 'Data collection & preprocessing,' 'Models' generation,' and 'Models' evaluation.' The left section shows raw data handling, including missing data visualization and preprocessing steps like outlier removal and normalization. The central section displays Generative Adversarial Network (GAN) architectures used for a 'Missing data imputation model' and a 'Synthetic data generation model.' The right section focuses on evaluation, showing plots of imputed data on unseen datasets, performance metrics, comparisons with state-of-the-art (SOTA) methods, and side-by-side vertical well log plots of real versus synthetic data

Types of Well Logs We Digitize

We provide digitization services for a wide variety of log curves, including:

Gamma Ray (GR)
Resistivity Logs
Density Logs
Neutron Logs
Sonic Logs
SP Logs
Caliper Logs
Porosity Logs
Lithology Logs
Mud Logs.
Our experienced geophysicists ensure accurate curve tracing, depth calibration, and data validation throughout the digitization process.
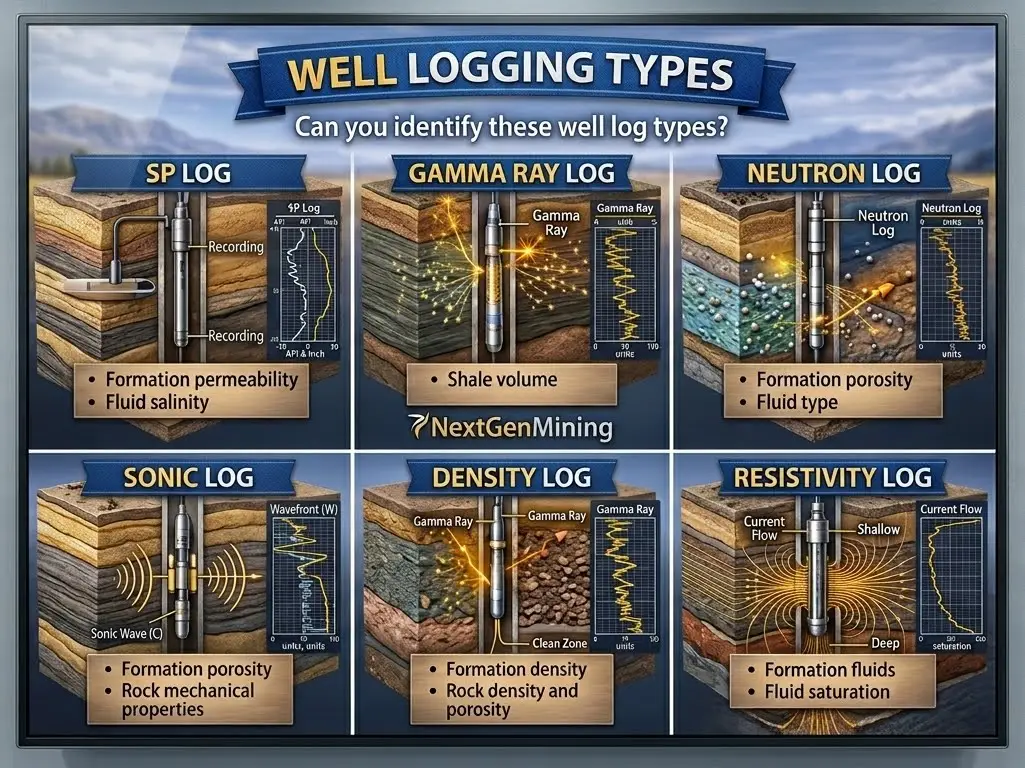
An educational info graphic titled 'WELL LOGGING TYPES' by NextGenMining. It features a 2x3 grid of 3D cross-sectional illustrations, each depicting a logging tool inside a geological borehole alongside a sample data graph. The six highlighted types are: SP LOG (measuring formation permeability and fluid salinity), GAMMA RAY LOG (measuring shale volume), NEUTRON LOG (measuring formation porosity and fluid type), SONIC LOG (measuring formation porosity and rock mechanical properties), DENSITY LOG (measuring formation density and porosity), and RESISTIVITY LOG (measuring formation fluids and fluid saturation).

Advanced Quality Control & Data Validation

At R2V Technologies, quality assurance is a critical part of every project. Our digitization workflow includes:

Manual and semi-automated curve tracing.
Depth matching and calibration.
Noise removal and image enhancement.
Curve editing and correction.
Multi-stage quality checks.
Final validation before delivery.

This ensures highly reliable digital well log data for subsurface interpretation and reservoir studies.

Applications of Digitized Well Log Data

Digitized well log data supports multiple upstream oil & gas activities, including:

Reservoir Characterization
Petrophysical Analysis
Geological Modeling
Formation Evaluation
Basin Studies
Exploration & Production
Planning Subsurface
Correlation Studies

Our Work
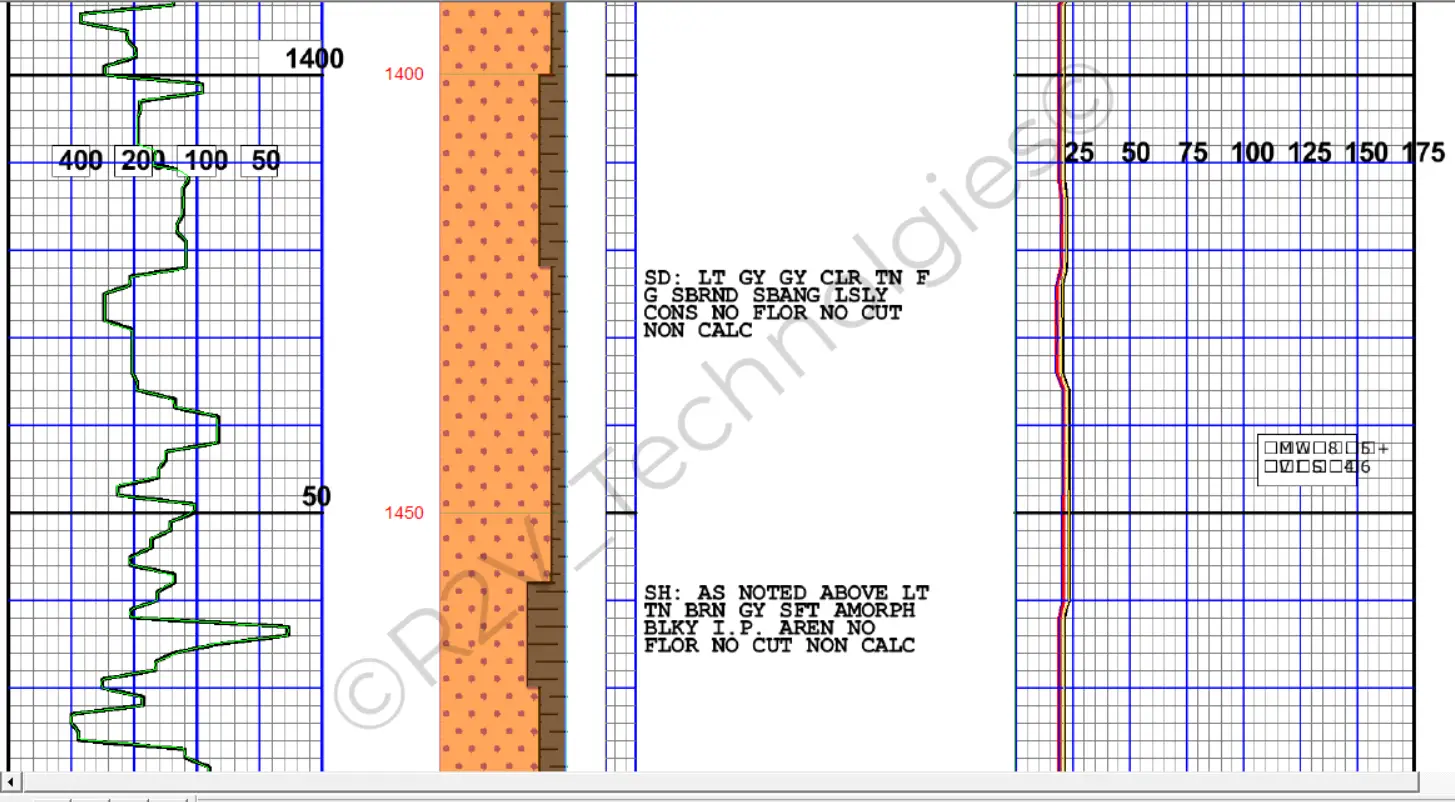
A digital well log or mud log interface displaying geological data across multiple vertical tracks for depths between 1400 and 1450. The left track contains a jagged green curve plotted on a logarithmic grid. The center tracks feature a vertical orange lithology column indicating sandstone, next to textual geological descriptions with abbreviations for sand and shale properties. The right track displays several straight, tightly grouped colored lines on a linear grid scaled from 25 to 175. A faint, diagonal watermark reading '© R2V Technologies' overlays the center of the image.
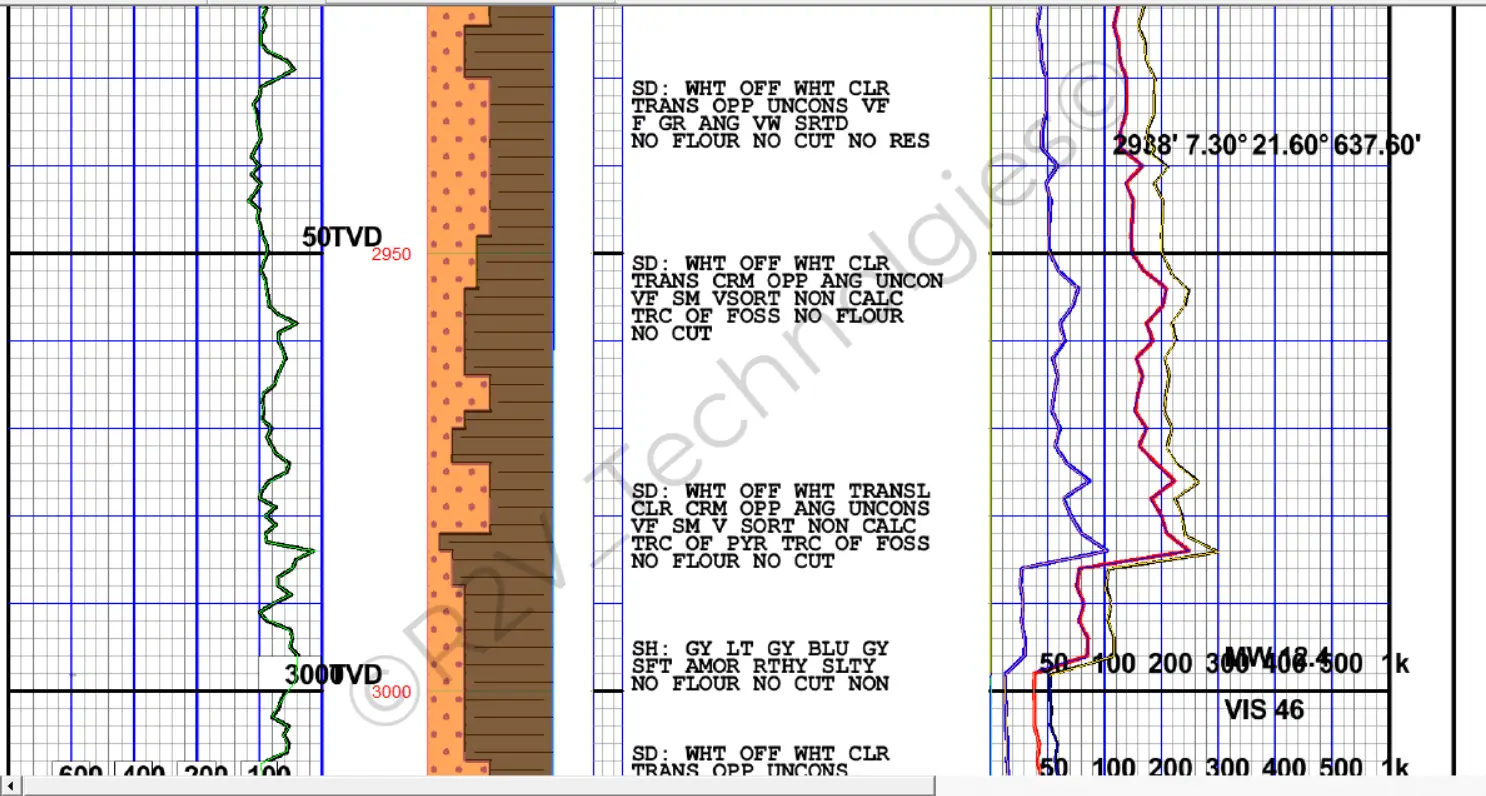
A digital well log or mud log interface displaying geological data across multiple vertical tracks for depths between approximately 2950 and 3000 TVD. The left track contains a jagged green data curve. The center tracks feature a vertical lithology column showing interlocking orange sandstone and brown shale patterns, adjacent to detailed textual geological descriptions with abbreviations for sand (SD) and shale (SH) properties. The right track displays three distinct jagged curves in purple, red, and yellow on a grid scaled from 50 to 1k, along with text annotations such as 'MW 8.4' and 'VIS 46'. A faint diagonal watermark reading '© R2V Technologies' overlays the center-right portion of the image.
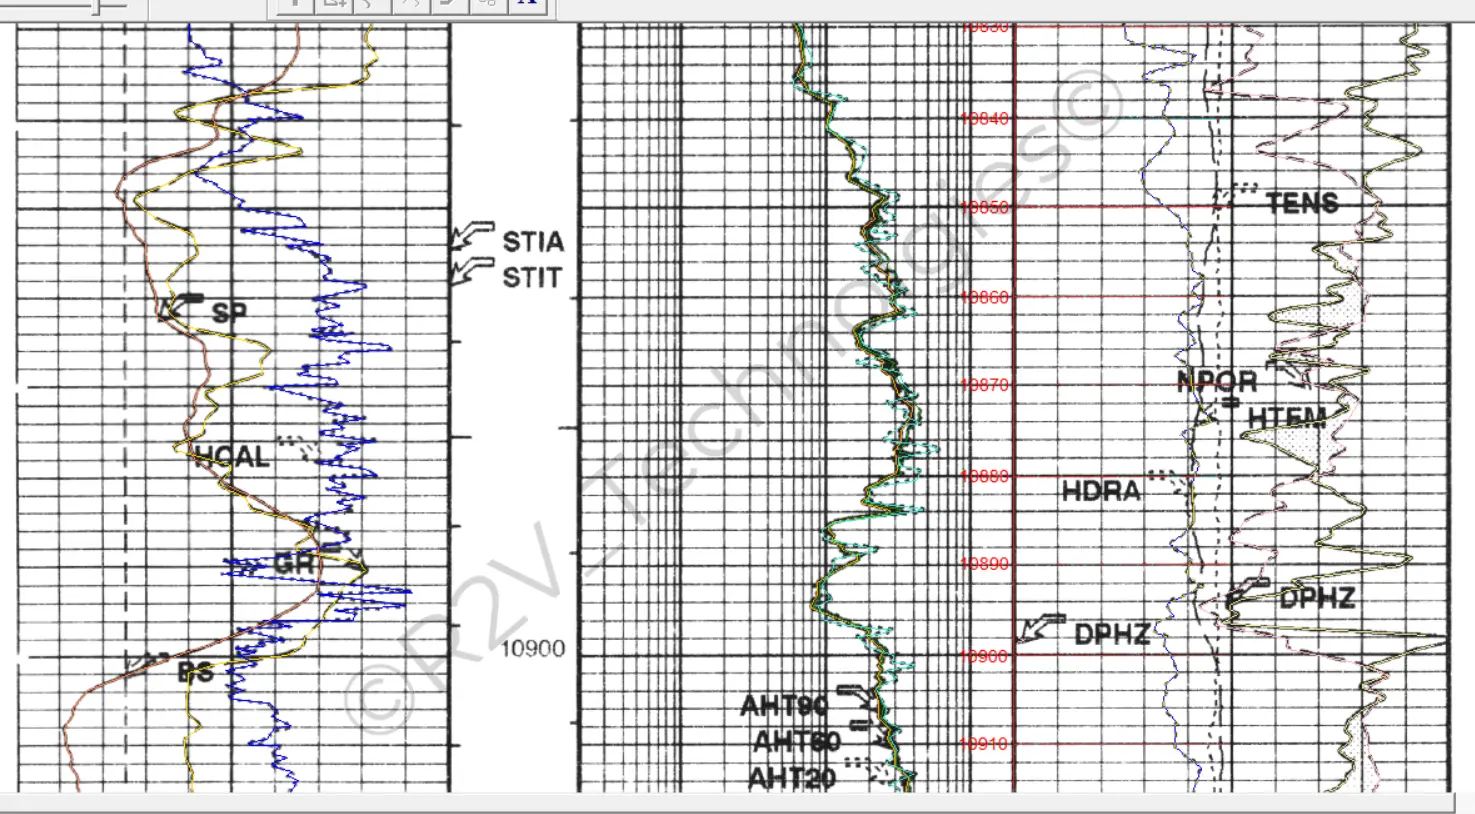
A digital well log interface displaying multiple vertical tracks of geophysical data curves. The left track features overlapping curves labeled SP, HCAL, GR, and BS plotted on a linear grid. A narrow central column displays depth markers around 10900. The right section includes a logarithmic track with tightly grouped resistivity curves labeled AHT90, AHT60, and AHT20, adjacent to another linear track showing TENS, NPOR, HTEM, HDRA, and DPHZ curves, with shaded crossover areas between the porosity curves. A faint diagonal watermark reading '© R2V Technologies' spans across the image.
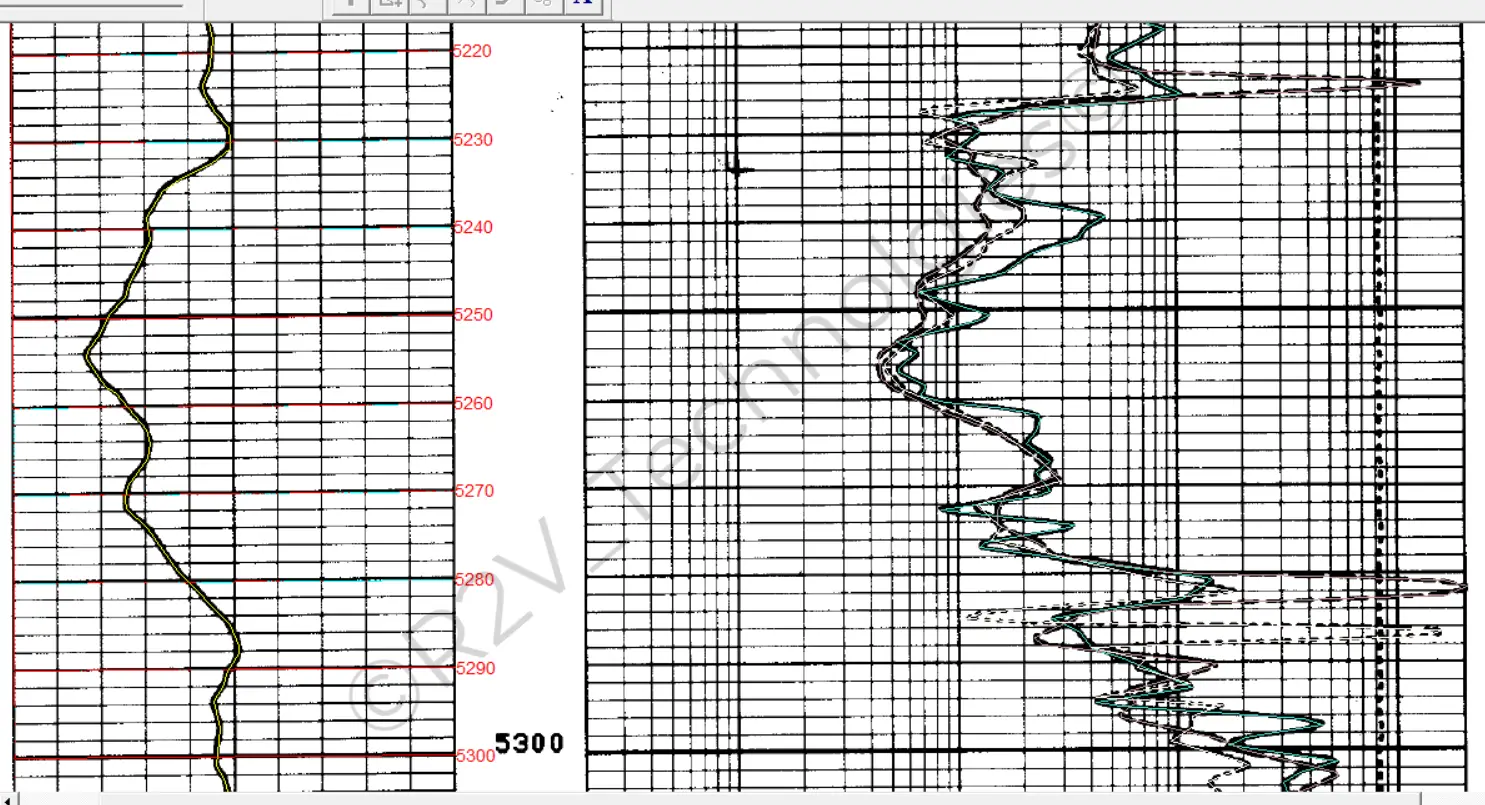
A digital well log interface displaying vertical tracks of geophysical data for depths between 5220 and 5300. The left track features a single, solid dark curve plotted on a linear grid with red depth annotations. The right track displays multiple overlapping curves, including a solid teal line and dashed dark lines, plotted on a logarithmic grid. A faint diagonal watermark reading '© R2V Technologies' overlays the center of the image